Gold Analysis – 27.Aug.2026
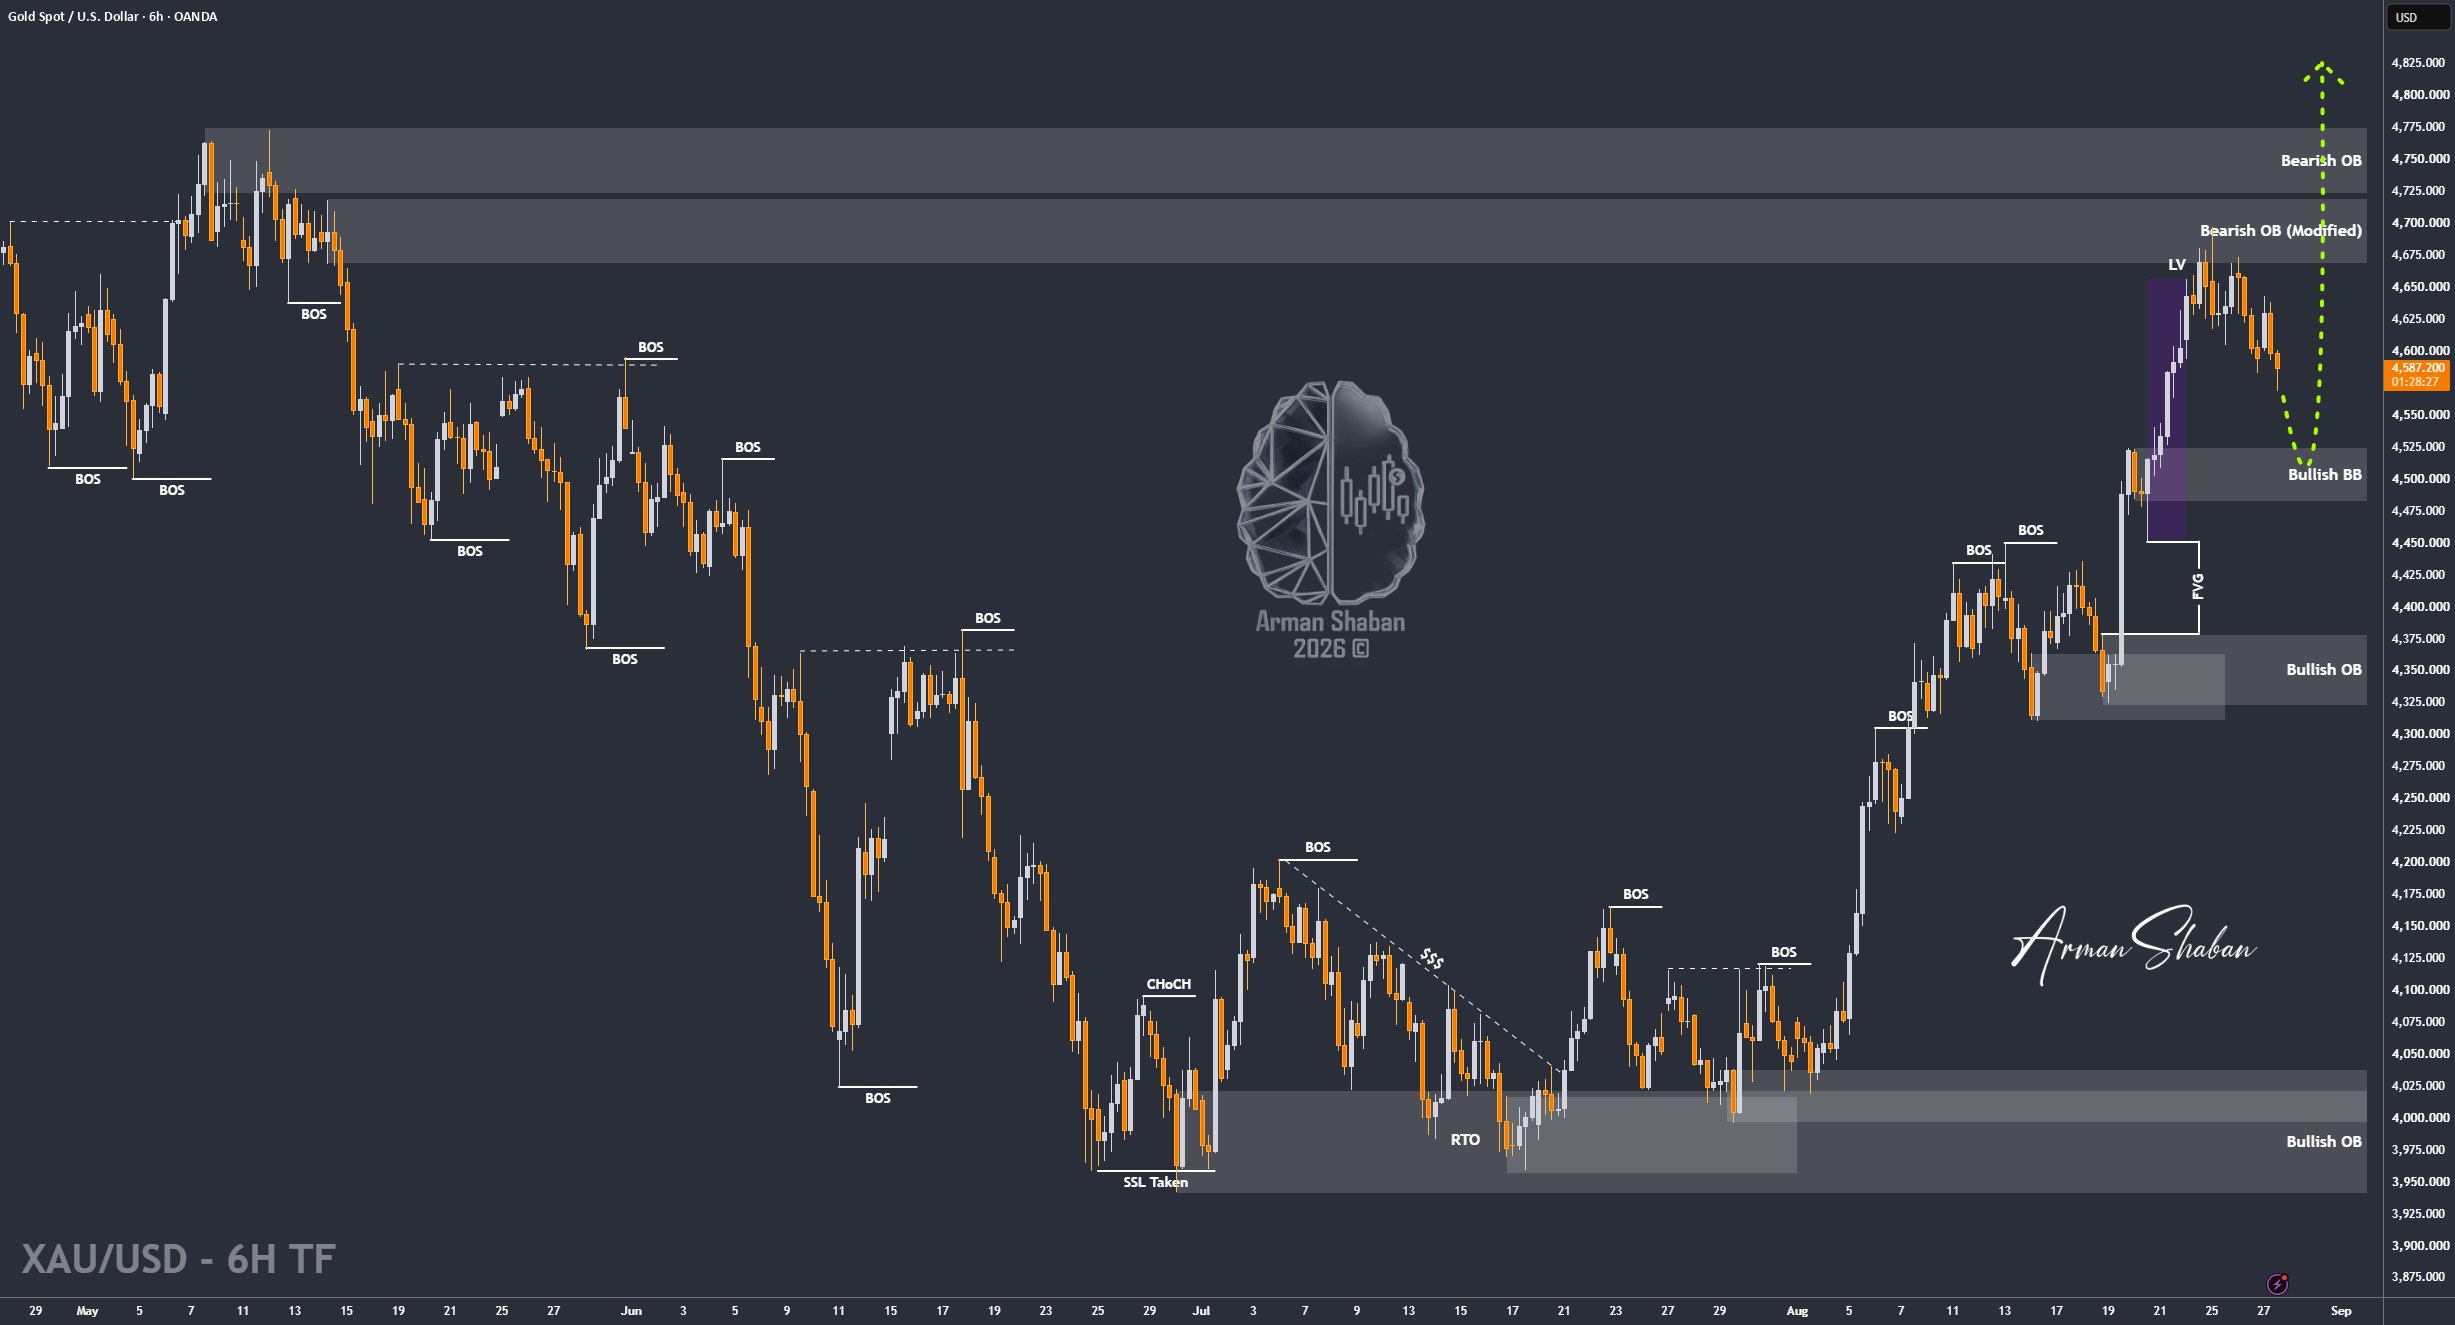
Gold Analysis: By analyzing the #Gold chart on the 6H timeframe, we can see that after the previous analysis, Gold continued to move lower exactly as expected and dropped toward the $4569 region, bringing the total movement from this setup to more than 1200 pips.
Currently, Gold is trading around $4593. The broader structure still remains bullish, but in the short term we are clearly inside a corrective phase and, in my view, this correction may still have more room to continue.
The nearest supply zones to monitor are around $4610 – $4630, followed by the stronger $4660 – $4690 area. On the downside, the first important levels are around $4560 – $4570, followed by $4523, $4500, and finally the major $4482 – $4523 demand zone.
This $4482 – $4523 area is especially important. If Gold reaches this zone and buyers step in strongly, I believe it could become the starting point for the next major bullish wave. In that case, the upside targets I would monitor are $4600, followed by $4650, then $4700. If the broader bullish trend resumes with strong momentum, $4800, $4900, and even the psychological $5000 level could become realistic medium-term targets.
So for now, the main picture is simple: the broader trend is still bullish, but the short-term correction may not be finished yet. The reaction from the $4482 – $4523 demand zone could become extremely important for the next major move.
(This Post on TradingView)
Author : Arman Shaban
To see more analyzes of Gold , Forex Pairs , Cryptocurrencies , Indices and Stocks , be sure to Follow and Join us on other Platforms :
– Public Telegram Channel
– YouTube Channel
– TradingView
– X (Twitter)
– How to join our FOREX VIP Channel ?
– How to join our Crypto VIP Channel ?
– CONTACT ME directly on Telegram

