Gold Analysis – 16.Jul.2026
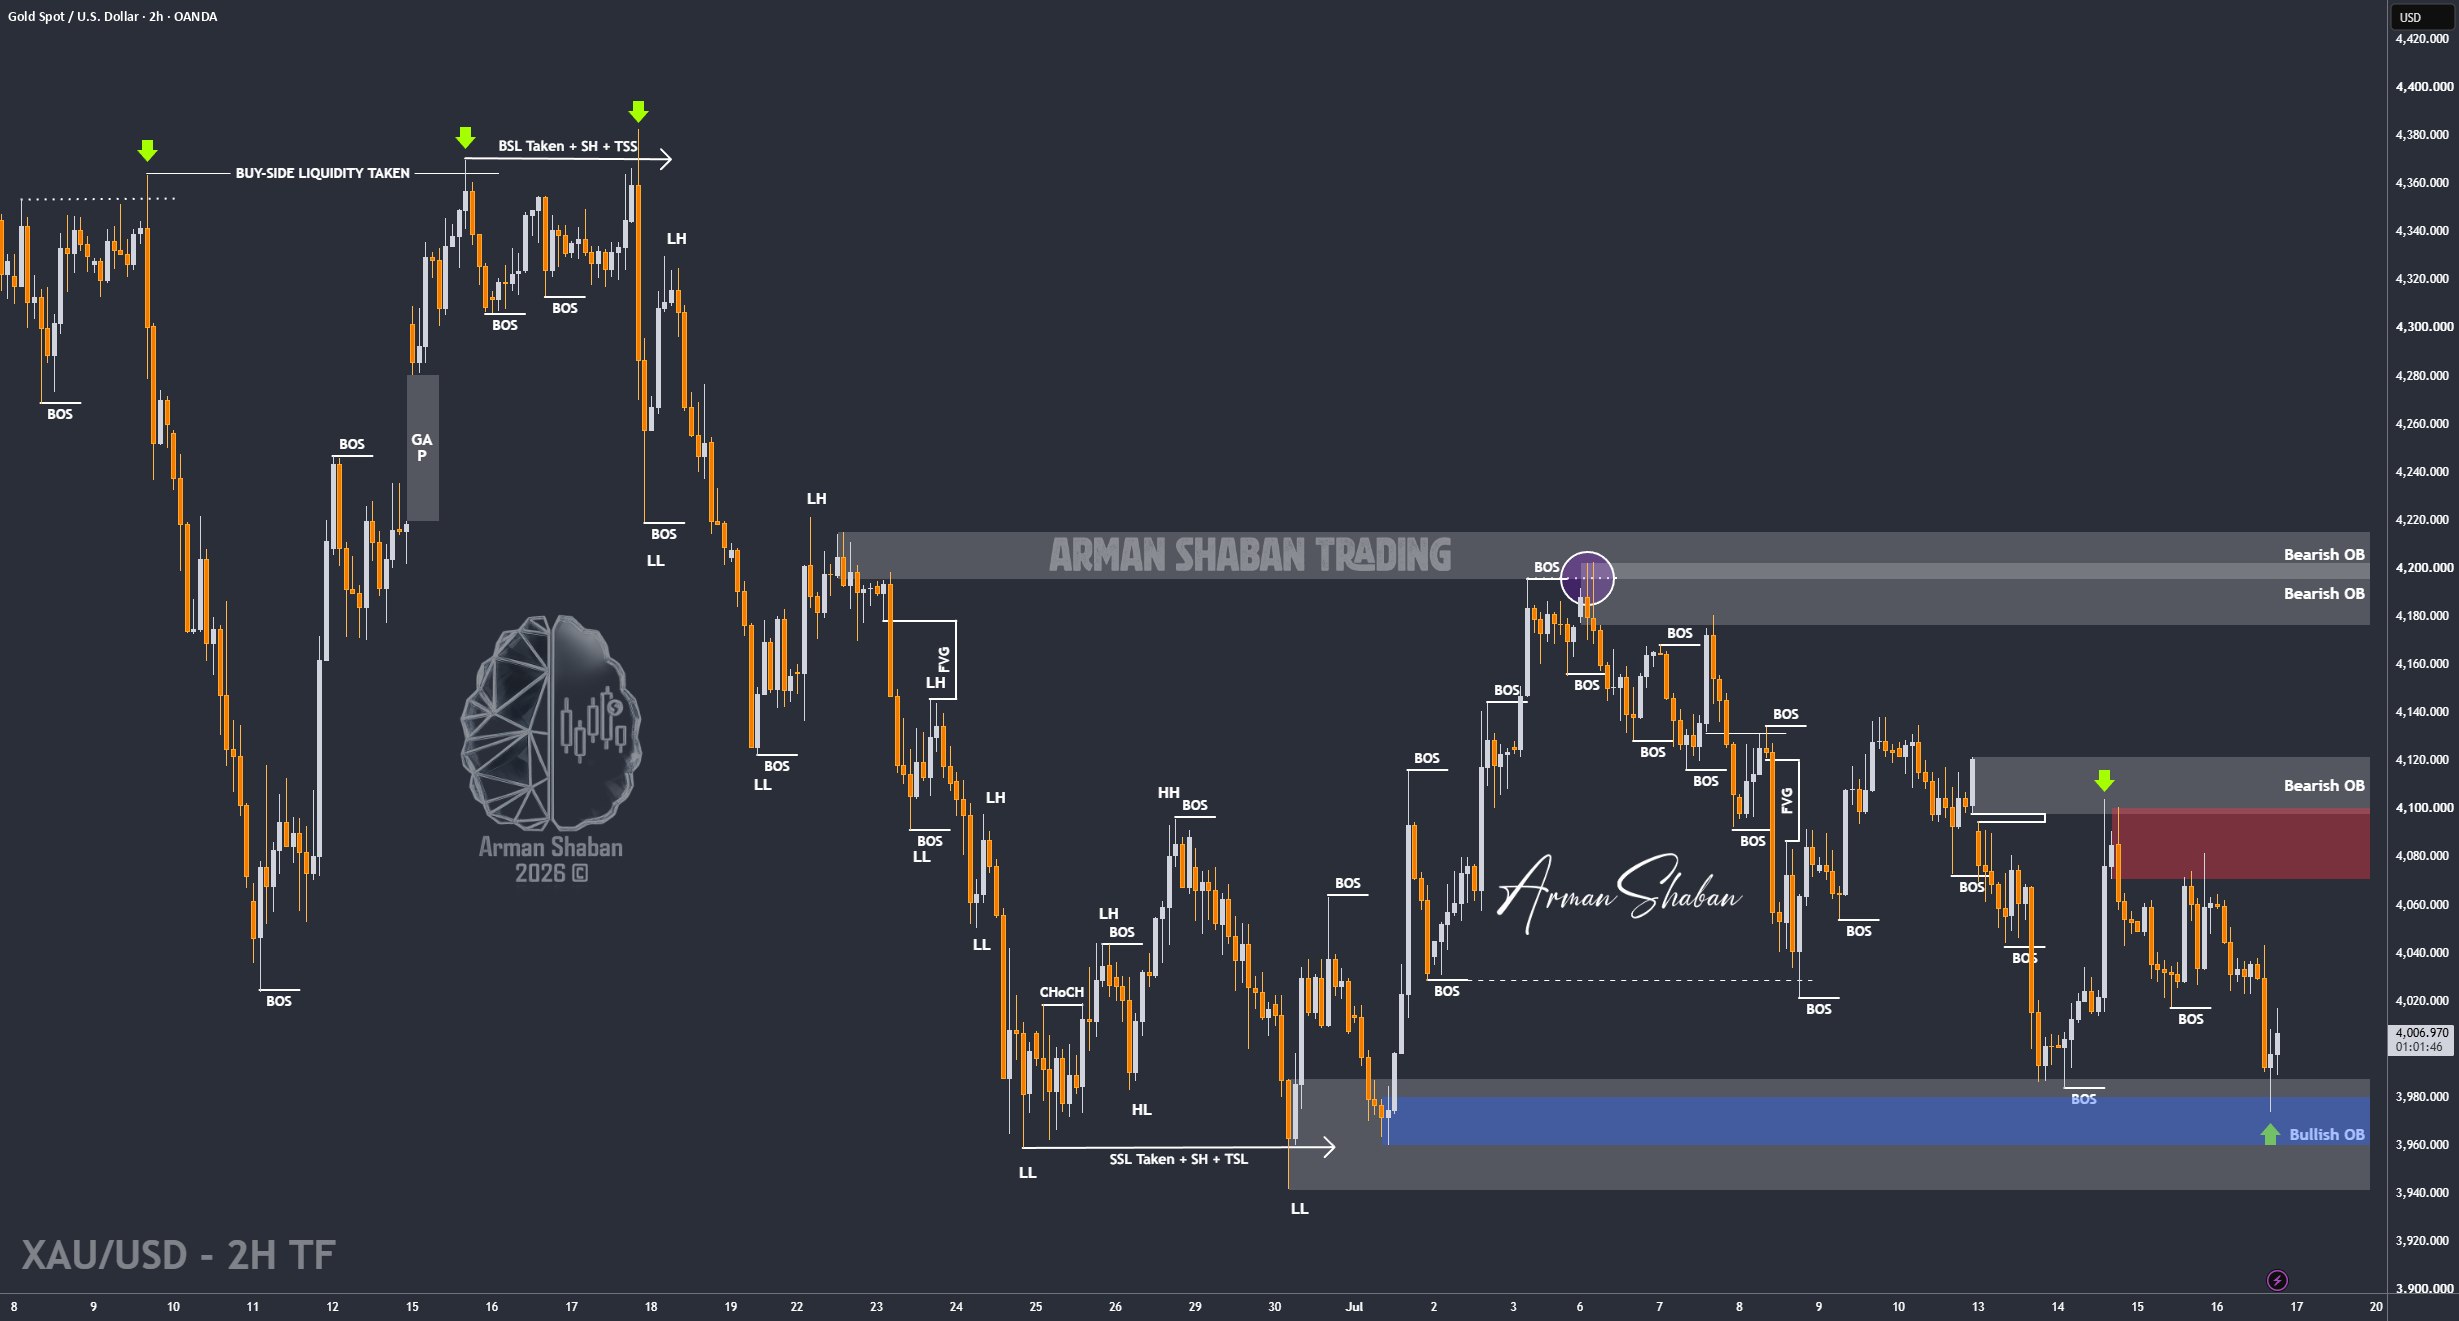
Gold Analysis: By analyzing the #Gold chart on the 2H timeframe, we can see that after the previous analysis, price first moved slightly higher toward the $4060 – $4080 supply zone. Once Gold entered this area, sellers stepped in aggressively and pushed price down toward $3973, delivering more than 1070 pips of movement.
Currently, Gold is trading around $4012. Price may still move slightly higher in the short term, but my main bias remains bearish and I expect sellers to regain control from the nearby supply zones.
The closest supply zones are located around $4014 – $4020, followed by the stronger area between $4024 – $4044. On the downside, the nearest demand zones are around $3970 – $3985, followed by $3940 – $3955 and deeper support near $3900 – $3920.
My main target remains the large liquidity pool resting below $3941. As long as Gold remains below the current supply zones, I still expect price to eventually sweep this liquidity before any stronger recovery begins. For now, a short-term bounce is possible, but the broader scenario remains bearish.
(This Post on TradingView)
Author : Arman Shaban
To see more analyzes of Gold , Forex Pairs , Cryptocurrencies , Indices and Stocks , be sure to Follow and Join us on other Platforms :
– Public Telegram Channel
– YouTube Channel
– TradingView
– X (Twitter)
– How to join our FOREX VIP Channel ?
– How to join our Crypto VIP Channel ?
– CONTACT ME directly on Telegram

