Gold Analysis – 06.Jul.2026
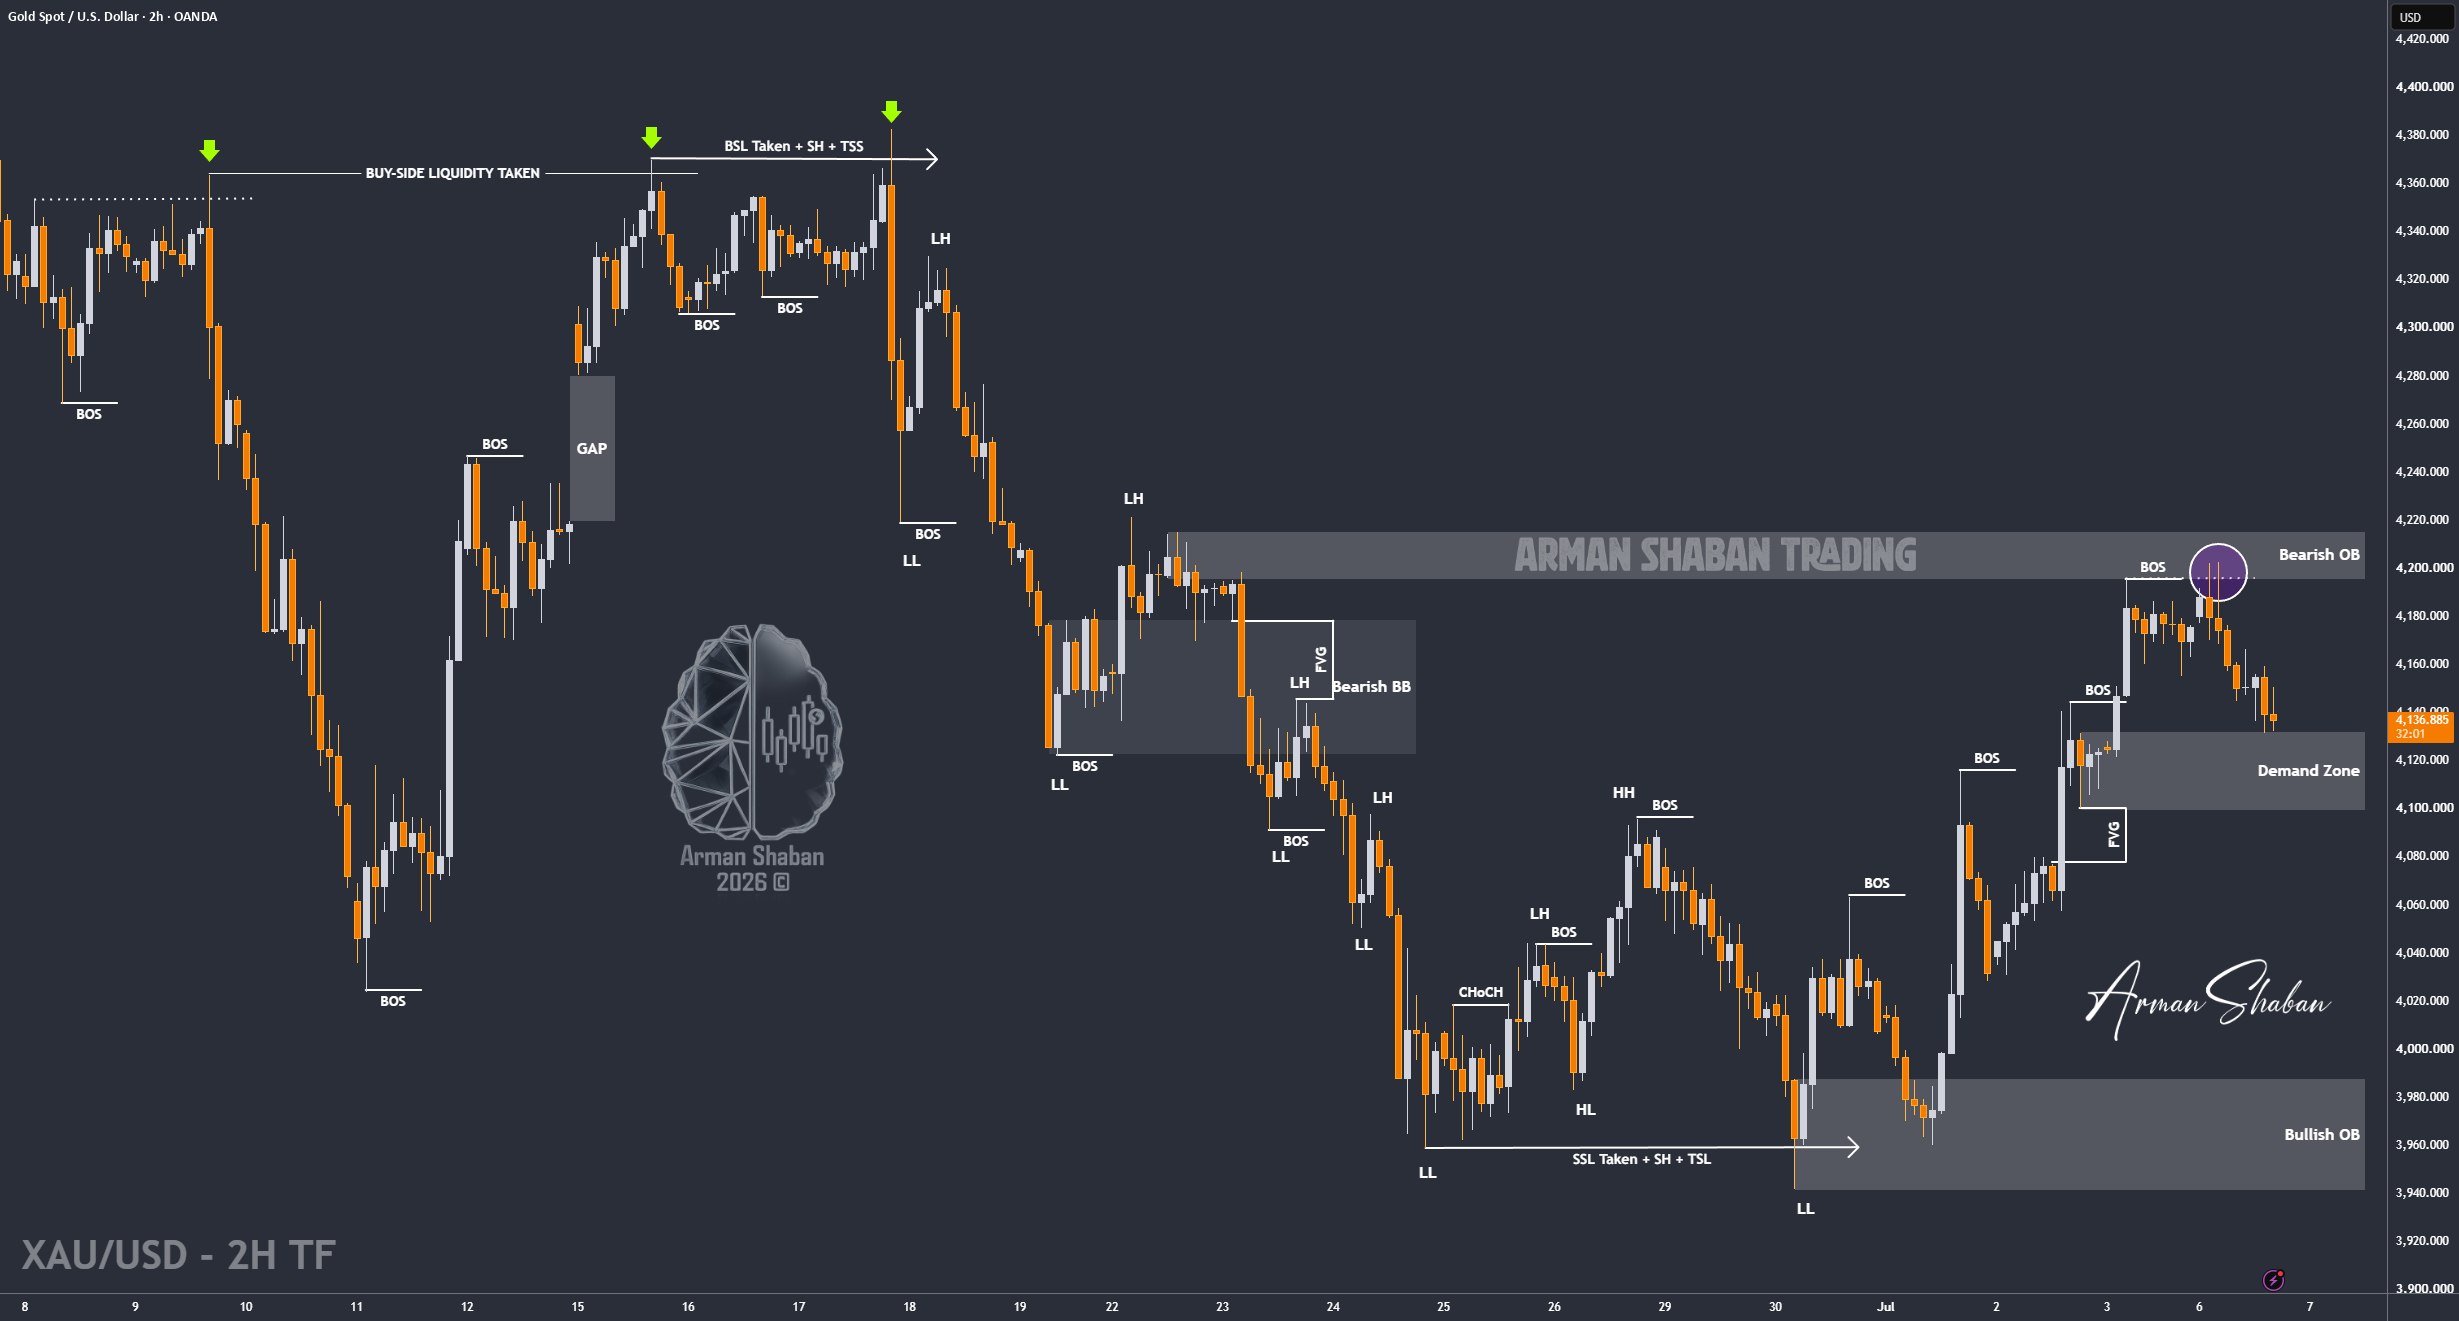
Gold Analysis: By analyzing the #Gold chart on the 2H timeframe, we can see that after the previous analysis, Gold first corrected toward the $4155 region. However, with the new weekly session open, buyers stepped in again and pushed price higher toward $4203, sweeping the liquidity above the previous $4195 high.
After this liquidity sweep, Gold faced selling pressure and dropped sharply toward the $4131.5 region. Currently, Gold is trading around $4135, and in my view, price may still need a deeper short-term correction before attempting the next bullish move. The next short-term downside targets to monitor are $4125, followed by $4120, then $4110 and $4100.
After this correction, we need to watch how buyers react around these levels. My main bias still remains bullish, and I still expect Gold to push toward levels above $4220 in the short term if buyers regain control.
(This Post on TradingView)
Author : Arman Shaban
To see more analyzes of Gold , Forex Pairs , Cryptocurrencies , Indices and Stocks , be sure to Follow and Join us on other Platforms :
– Public Telegram Channel
– YouTube Channel
– TradingView
– X (Twitter)
– How to join our FOREX VIP Channel ?
– How to join our Crypto VIP Channel ?
– CONTACT ME directly on Telegram

