Gold Analysis – 26.Jun.2026
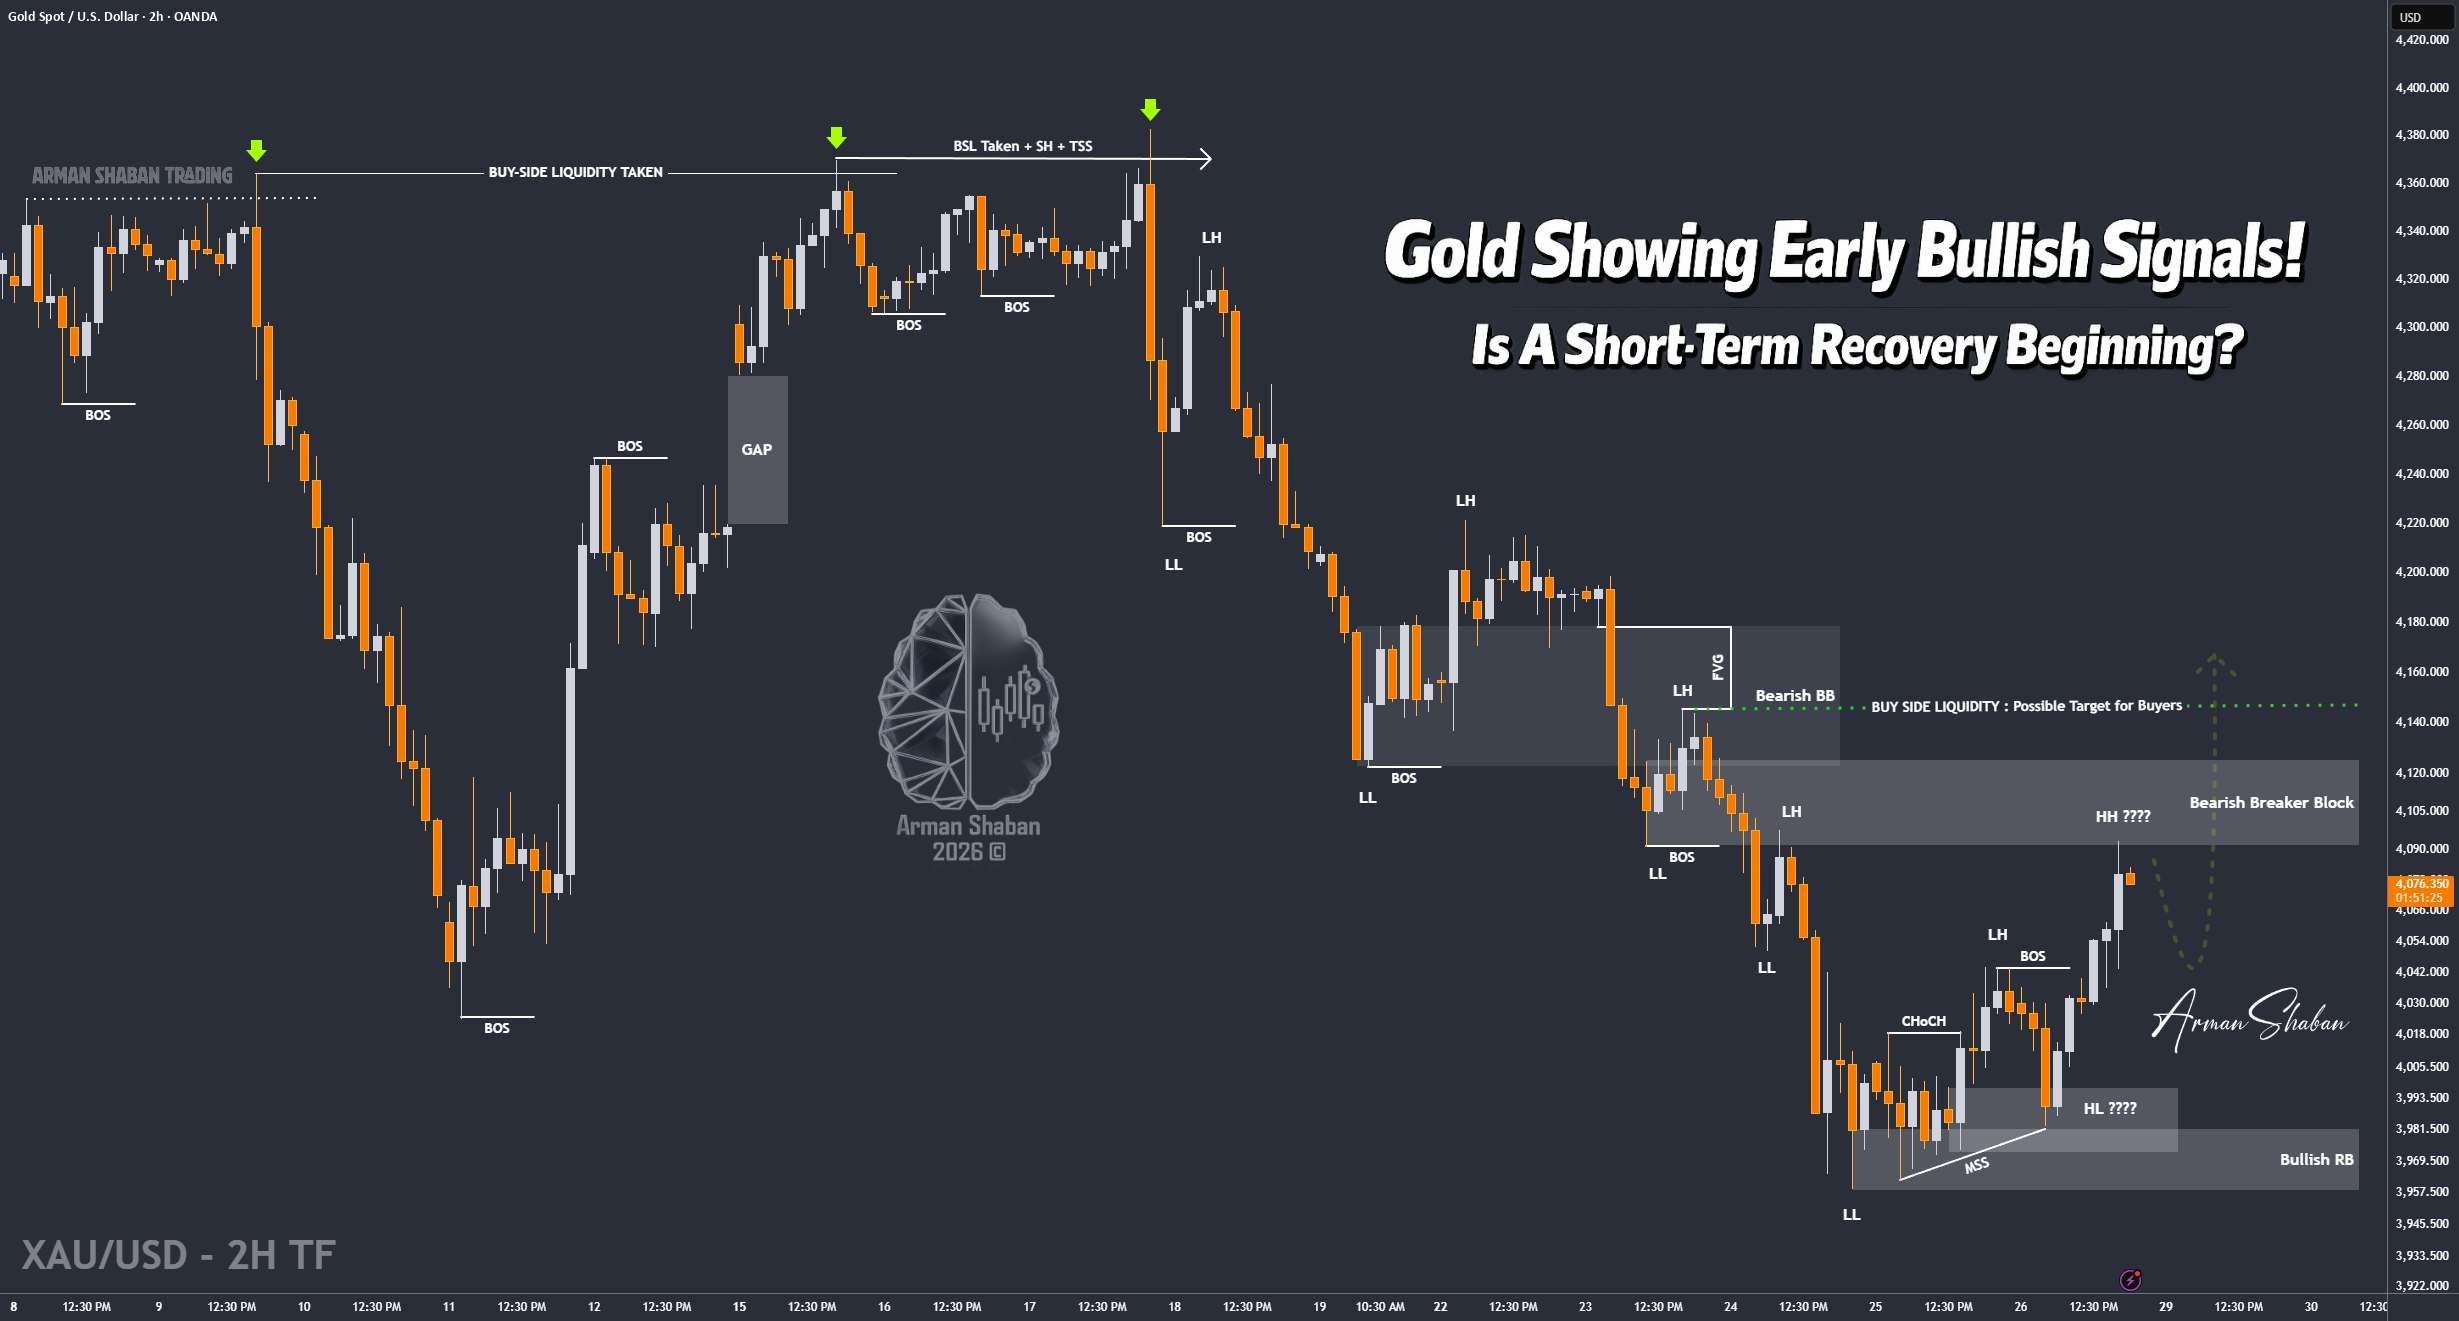
Gold Analysis: By analyzing the #Gold chart on the 2H timeframe, we can see that this is a completely new outlook for Gold. After dropping to the $3958 region yesterday, buyers stepped in and triggered a strong recovery toward $4093. While this rally has been impressive, it is still relatively small compared to Gold’s broader decline from around $5600 to $3958.
After reaching the key supply zone between $4092 and $4125, Gold experienced a minor pullback and is currently trading around the $4085 region.
One of the most important developments is that, for the first time in nearly two weeks, the chart is now printing Higher Highs (HH) and Higher Lows (HL). In addition, we are also seeing a clear CHOCH followed by a BOS, all of which are marked on the chart. These are early technical signals that buyers may be attempting to regain short-term control.
The nearest demand zone is located between $4025 and $4045. As long as Gold manages to stabilize above this area, the probability of further upside continuation increases. On the upside, the next bullish targets to monitor are $4100, followed by $4113, $4125, and $4145. Although the broader trend remains under pressure, the recent price structure suggests that Gold could be preparing for a short-term bullish correction before the next major move develops.
(This Post on TradingView)
Author : Arman Shaban
To see more analyzes of Gold , Forex Pairs , Cryptocurrencies , Indices and Stocks , be sure to Follow and Join us on other Platforms :
– Public Telegram Channel
– YouTube Channel
– TradingView
– X (Twitter)
– How to join our FOREX VIP Channel ?
– How to join our Crypto VIP Channel ?
– CONTACT ME directly on Telegram