Gold Analysis – 24.Jun.2026
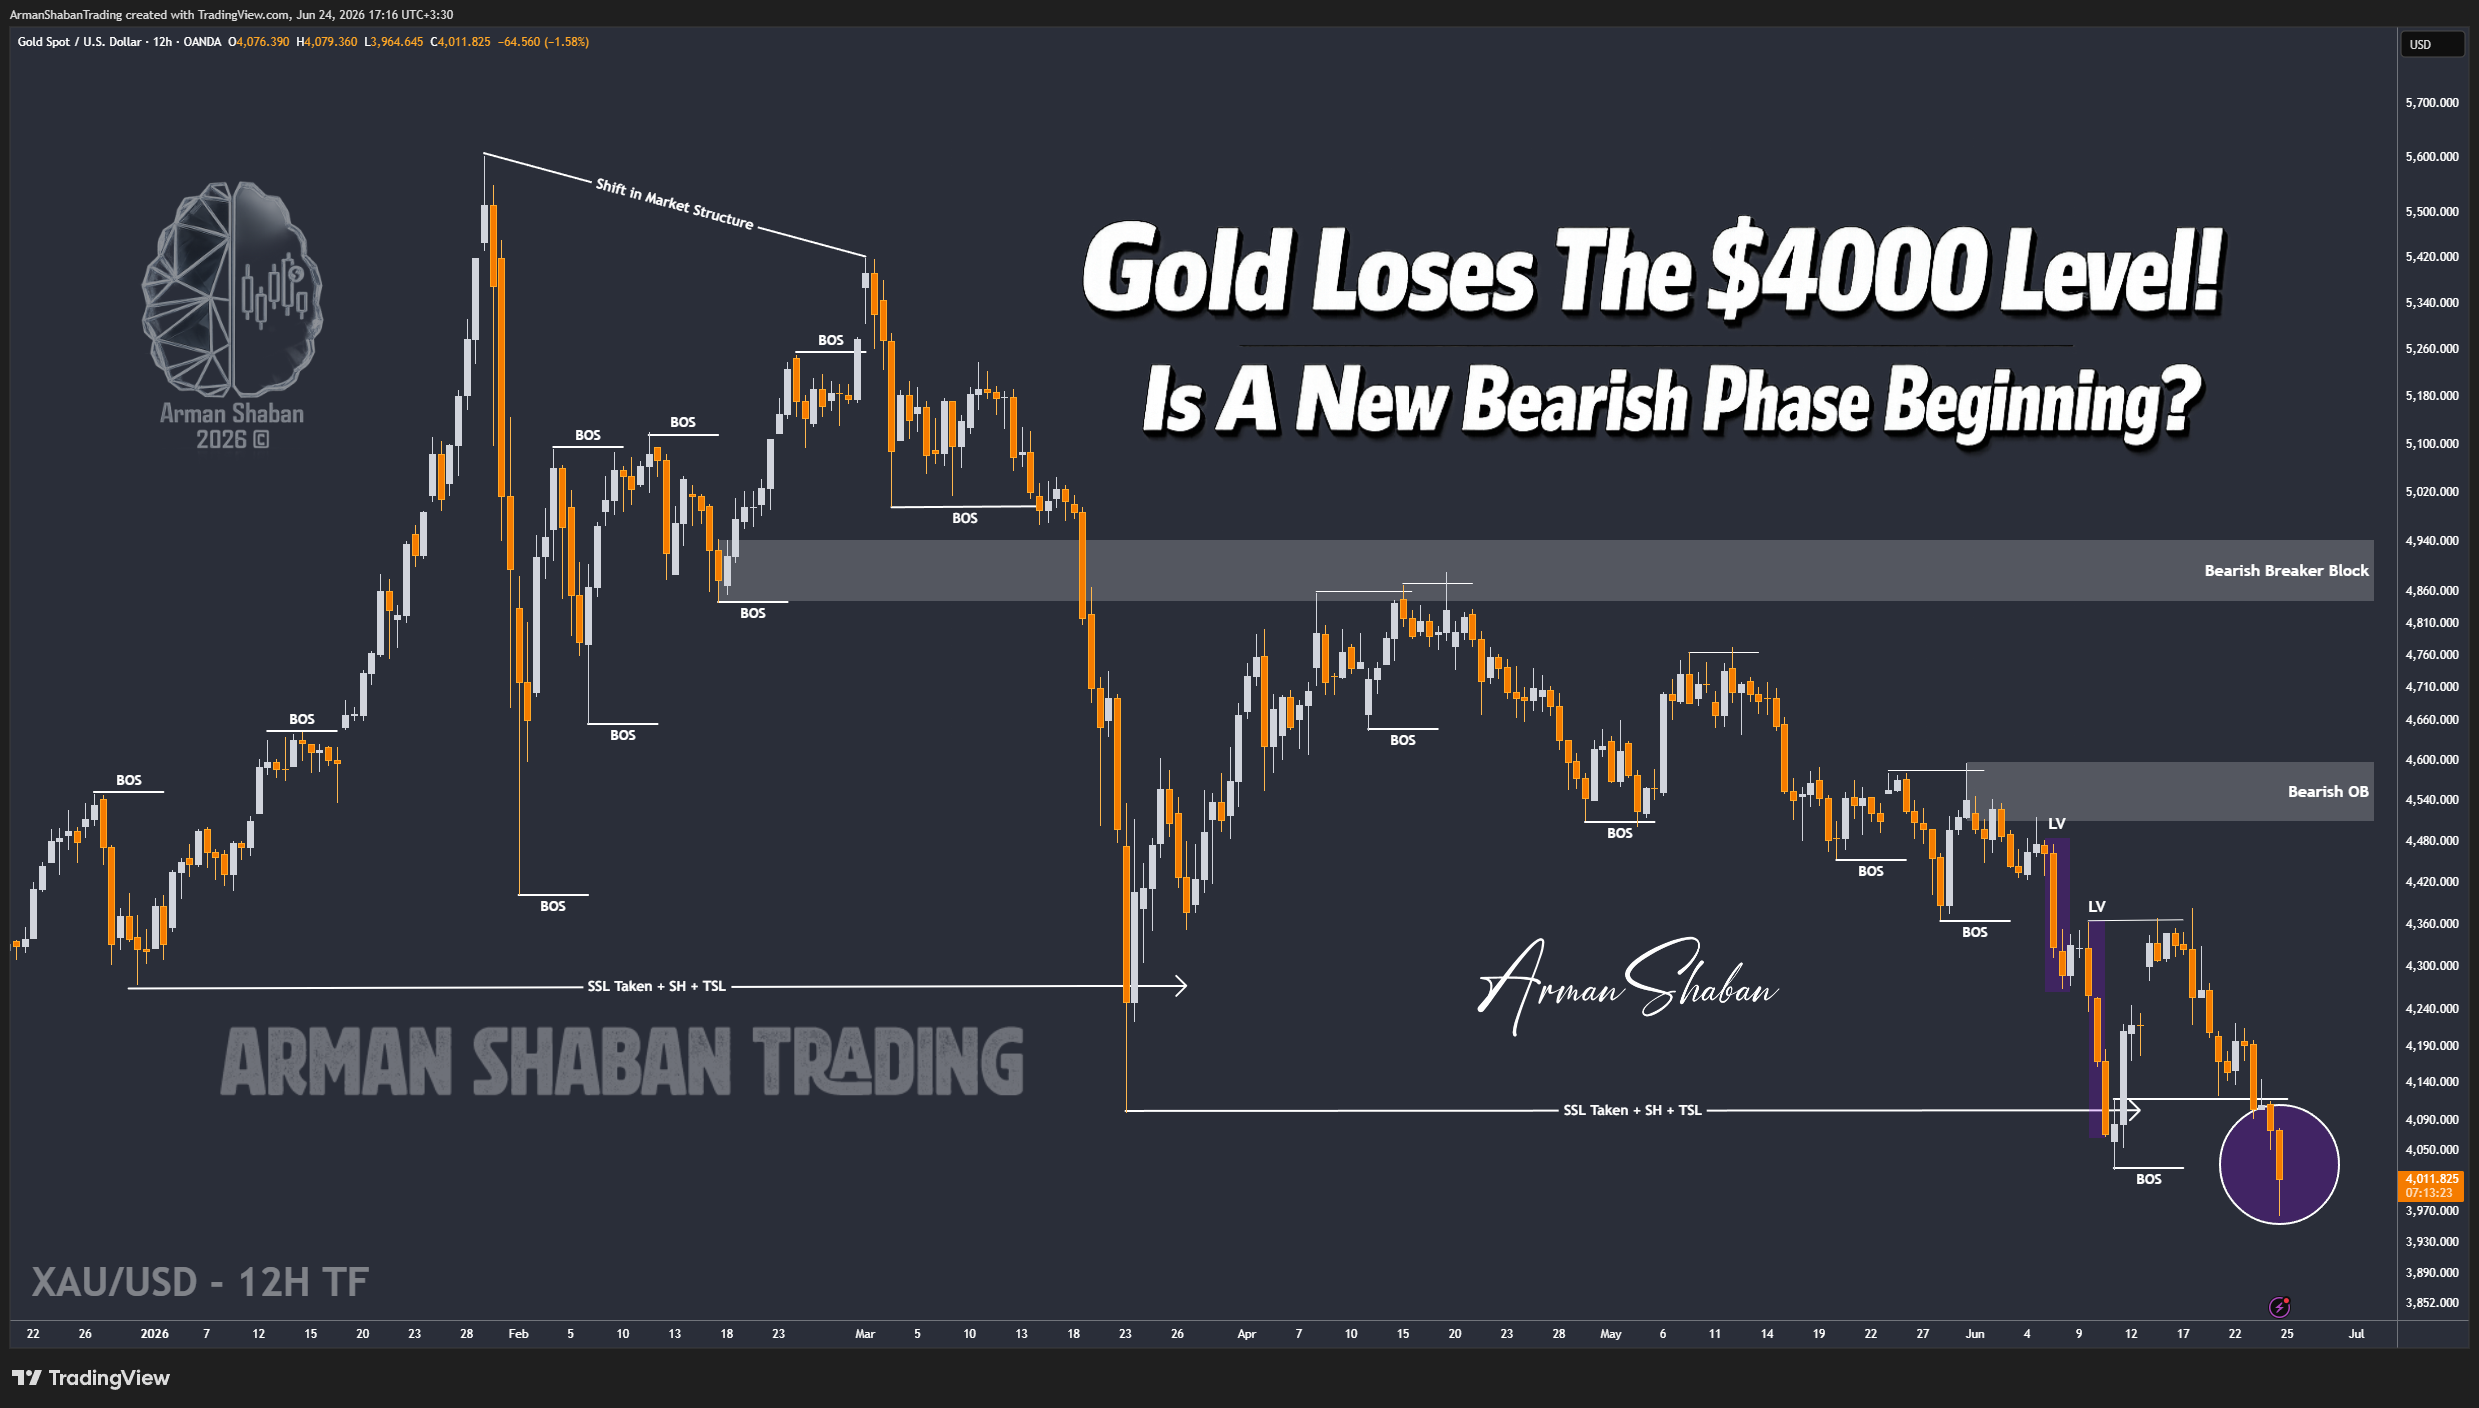
Gold Analysis: By analyzing the #Gold chart on the 4H timeframe, we can see that our previous bullish recovery scenario ultimately failed to materialize. Gold was unable to stabilize above the key $4119 demand zone and sellers regained control aggressively, triggering another heavy sell-off.
As a result, Gold finally broke below the major psychological $4000 level and entered the $3900 range. After reaching a fresh low around $3962, buyers stepped in once again and triggered a modest rebound, with Gold currently trading around the $3990 region.
From a fundamental perspective, I mentioned in last week’s analysis that if the uncertainty surrounding the U.S.-Iran agreement persisted, the probability of further downside would increase. However, Iran-related developments are no longer the only driver behind the market. A stronger U.S. Dollar, rising expectations for higher interest rates, and the recent stock market weakness have all contributed to increased demand for the Dollar, putting additional pressure on Gold.
From a structural perspective, the nearest demand zones are now located around $3960 – $3990, followed by deeper support between $3900 – $3930. On the upside, the nearest supply zones are located around $4020 – $4050, followed by a stronger resistance cluster between $4100 – $4140.
At this stage, market conditions have changed significantly and the previous analysis is no longer valid. A completely new Gold outlook will be released soon, as the market has entered a new phase and requires a fresh reassessment.
(This Post on TradingView)
Author : Arman Shaban
To see more analyzes of Gold , Forex Pairs , Cryptocurrencies , Indices and Stocks , be sure to Follow and Join us on other Platforms :
– Public Telegram Channel
– YouTube Channel
– TradingView
– X (Twitter)
– How to join our FOREX VIP Channel ?
– How to join our Crypto VIP Channel ?
– CONTACT ME directly on Telegram