Gold Analysis – 01.Jun.2026
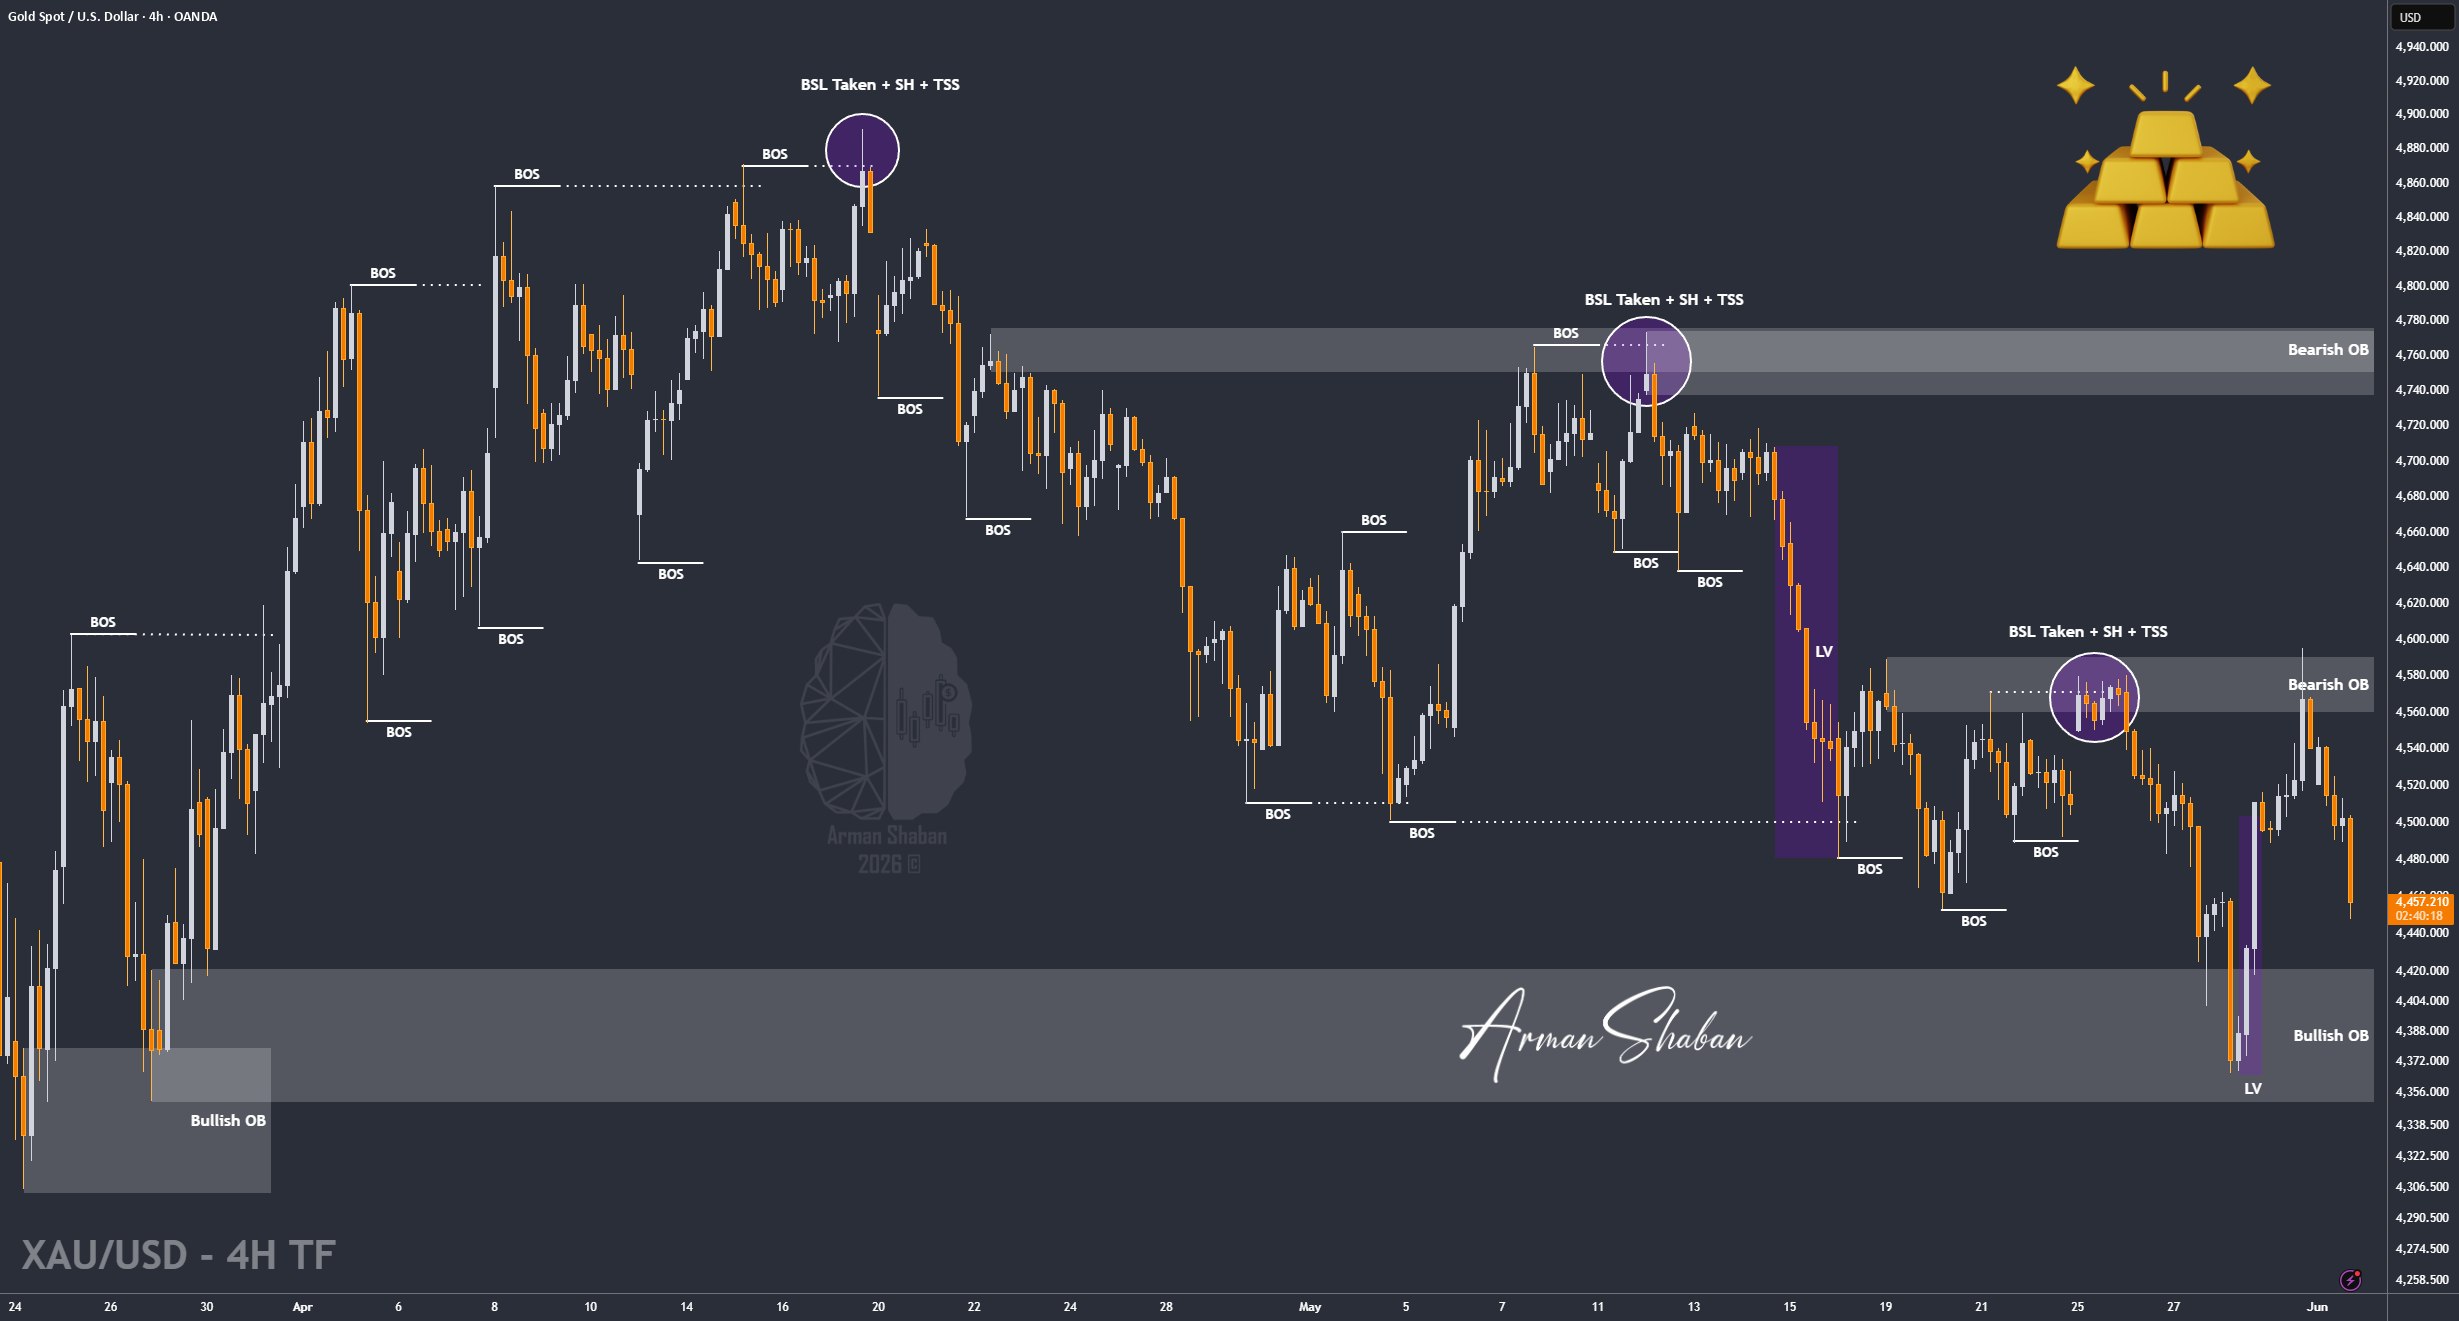
Gold Analysis: By analyzing the #Gold chart on the 4H timeframe, we can see that price once again followed the expected scenario. After trading around the $4540 region, Gold rallied strongly toward $4594, completing all projected upside targets before running into heavy selling pressure.
Following that rejection, Gold reversed sharply and closed Friday back near the $4540 level. With the new week underway, sellers returned aggressively and pushed Gold all the way down toward $4447. Currently, Gold is trading around the $4460 region, showing continued downside pressure.
The main driver behind this decline appears to be the renewed geopolitical uncertainty. Negotiation talks seem to be losing momentum again, tensions in the region are increasing, and markets are beginning to price in a higher probability of escalation rather than resolution.
From a structural perspective, the nearest supply zone is now located between $4488 – $4512. As long as price remains below this resistance area, the probability of further downside continuation remains elevated. The next major supply zone sits around $4540 – $4570.
On the downside, the closest demand zones are located around $4440 – $4460, followed by a stronger demand cluster between $4400 – $4420. If sellers manage to break below these supports, the next bearish targets would be $4420, followed by $4400, and potentially $4360 if bearish momentum accelerates.
For now, the broader bias remains bearish, and any rally into supply zones could attract fresh selling pressure unless market sentiment shifts significantly.
(This Post on TradingView)
Author : Arman Shaban
To see more analyzes of Gold , Forex Pairs , Cryptocurrencies , Indices and Stocks , be sure to Follow and Join us on other Platforms :
– Public Telegram Channel
– YouTube Channel
– TradingView
– X (Twitter)
– How to join our FOREX VIP Channel ?
– How to join our Crypto VIP Channel ?
– CONTACT ME directly on Telegram