Gold Analysis – 28.Jul.2025
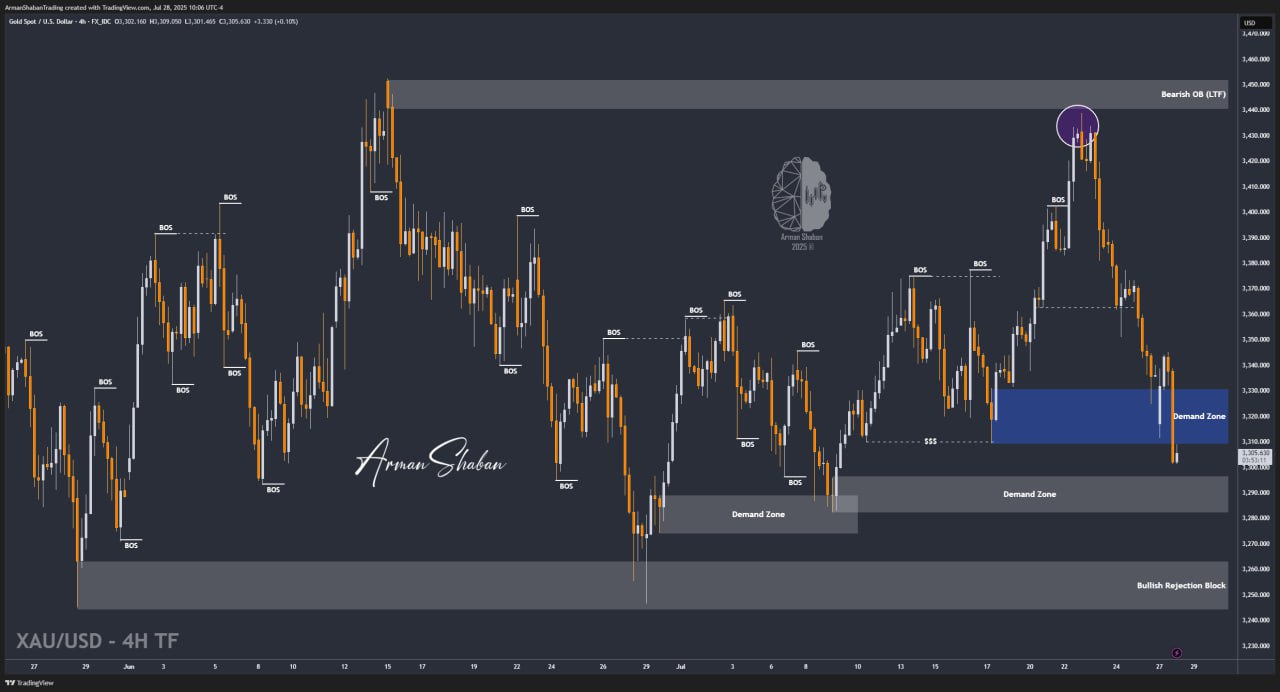
Gold Analysis: By analyzing the gold chart on the 4-hour timeframe, we can see that based on recent price action, if gold fails to hold the key support at $3300, we can expect increased selling pressure and a potential drop toward the next strong demand zone at $3282–$3296.
This area is considered a high-probability demand zone, where liquidity could be absorbed and a new bullish move may begin!
(This Post on TradingView)
Author : Arman Shaban
To see more analyzes of Gold , Forex Pairs , Cryptocurrencies , Indices and Stocks , be sure to Follow and Join us on other Platforms :
– Public Telegram Channel
– YouTube Channel
– TradingView
– X (Twitter)
– How to join our FOREX VIP Channel ?
– How to join our Crypto VIP Channel ?
– CONTACT ME directly on Telegram