Gold Analysis – 28.Jul.2025
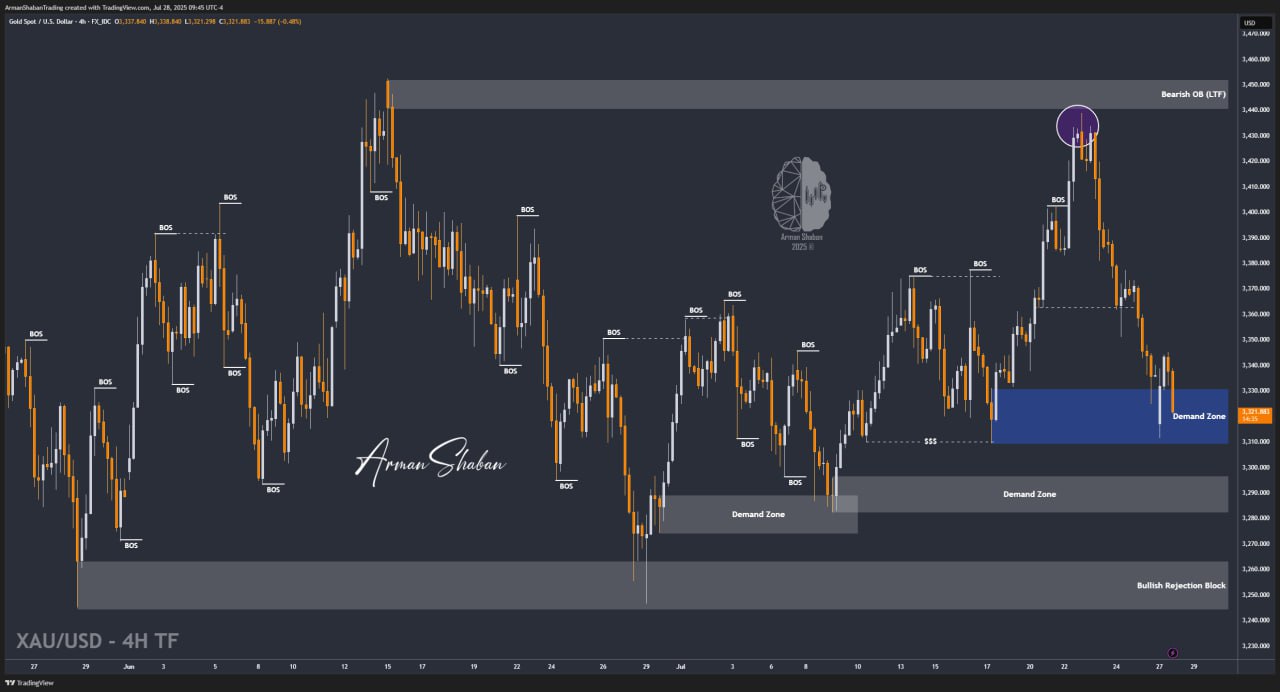
Gold Analysis: By analyzing the gold chart on the 4-hour timeframe, we can see that based on our latest analysis, after initially stabilizing above $3337, gold managed to climb to $3347, hitting the first target. However, the bullish move stopped there, and gold faced a sharp drop, eventually closing Friday at $3337. With the market opening today, we saw a negative price gap, opening at $3317, and after a brief dip to $3311, strong demand kicked in, pushing the price up to $3345 — a key demand zone that was already marked (blue area). Currently, gold is trading around $3324, and we need to see if, after a possible correction down to the $3309–$3311 range, it can find support again and begin another bullish move. This analysis will be updated soon!
(This Post on TradingView)
Author : Arman Shaban
To see more analyzes of Gold , Forex Pairs , Cryptocurrencies , Indices and Stocks , be sure to Follow and Join us on other Platforms :
– Public Telegram Channel
– YouTube Channel
– TradingView
– X (Twitter)
– How to join our FOREX VIP Channel ?
– How to join our Crypto VIP Channel ?
– CONTACT ME directly on Telegram