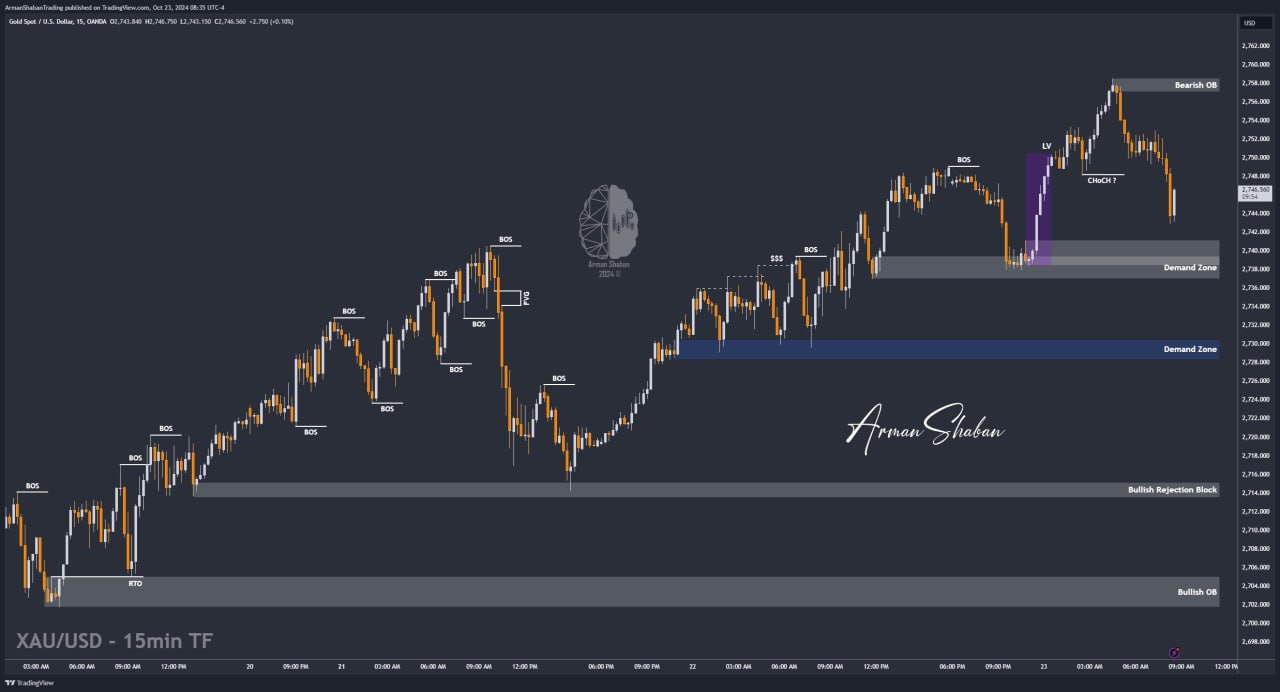
Gold Analysis – 23.Oct.2024

Gold Analysis: By analyzing the gold chart in the 15-minute timeframe, we can see that, as expected, gold successfully hit the targets of $2738.5, $2740, and $2743.7 yesterday, and ultimately achieved over 250 pips of profit, setting a new record at $2758.8! After reaching this price level, we witnessed a drop in gold to $2743, which was a retracement aimed at filling the liquidity void caused by the previous rally. The $2737 to $2741 range is an important demand zone. We’ll need to see how the price reacts if it reaches this level. My view remains bullish, as today’s drop has created another liquidity void, and I expect this gap to be filled soon with gold’s renewed upward movement.
(This Post on TradingView)
Author : Arman Shaban
To see more analyzes of Gold , Forex Pairs , Cryptocurrencies , Indices and Stocks , be sure to Follow and Join us on other Platforms :
– Public Telegram Channel
– YouTube Channel
– TradingView
– X (Twitter)
– How to join our FOREX VIP Channel ?
– How to join our Crypto VIP Channel ?
– CONTACT ME directly on Telegram