Gold Analysis – 18.Oct.2024
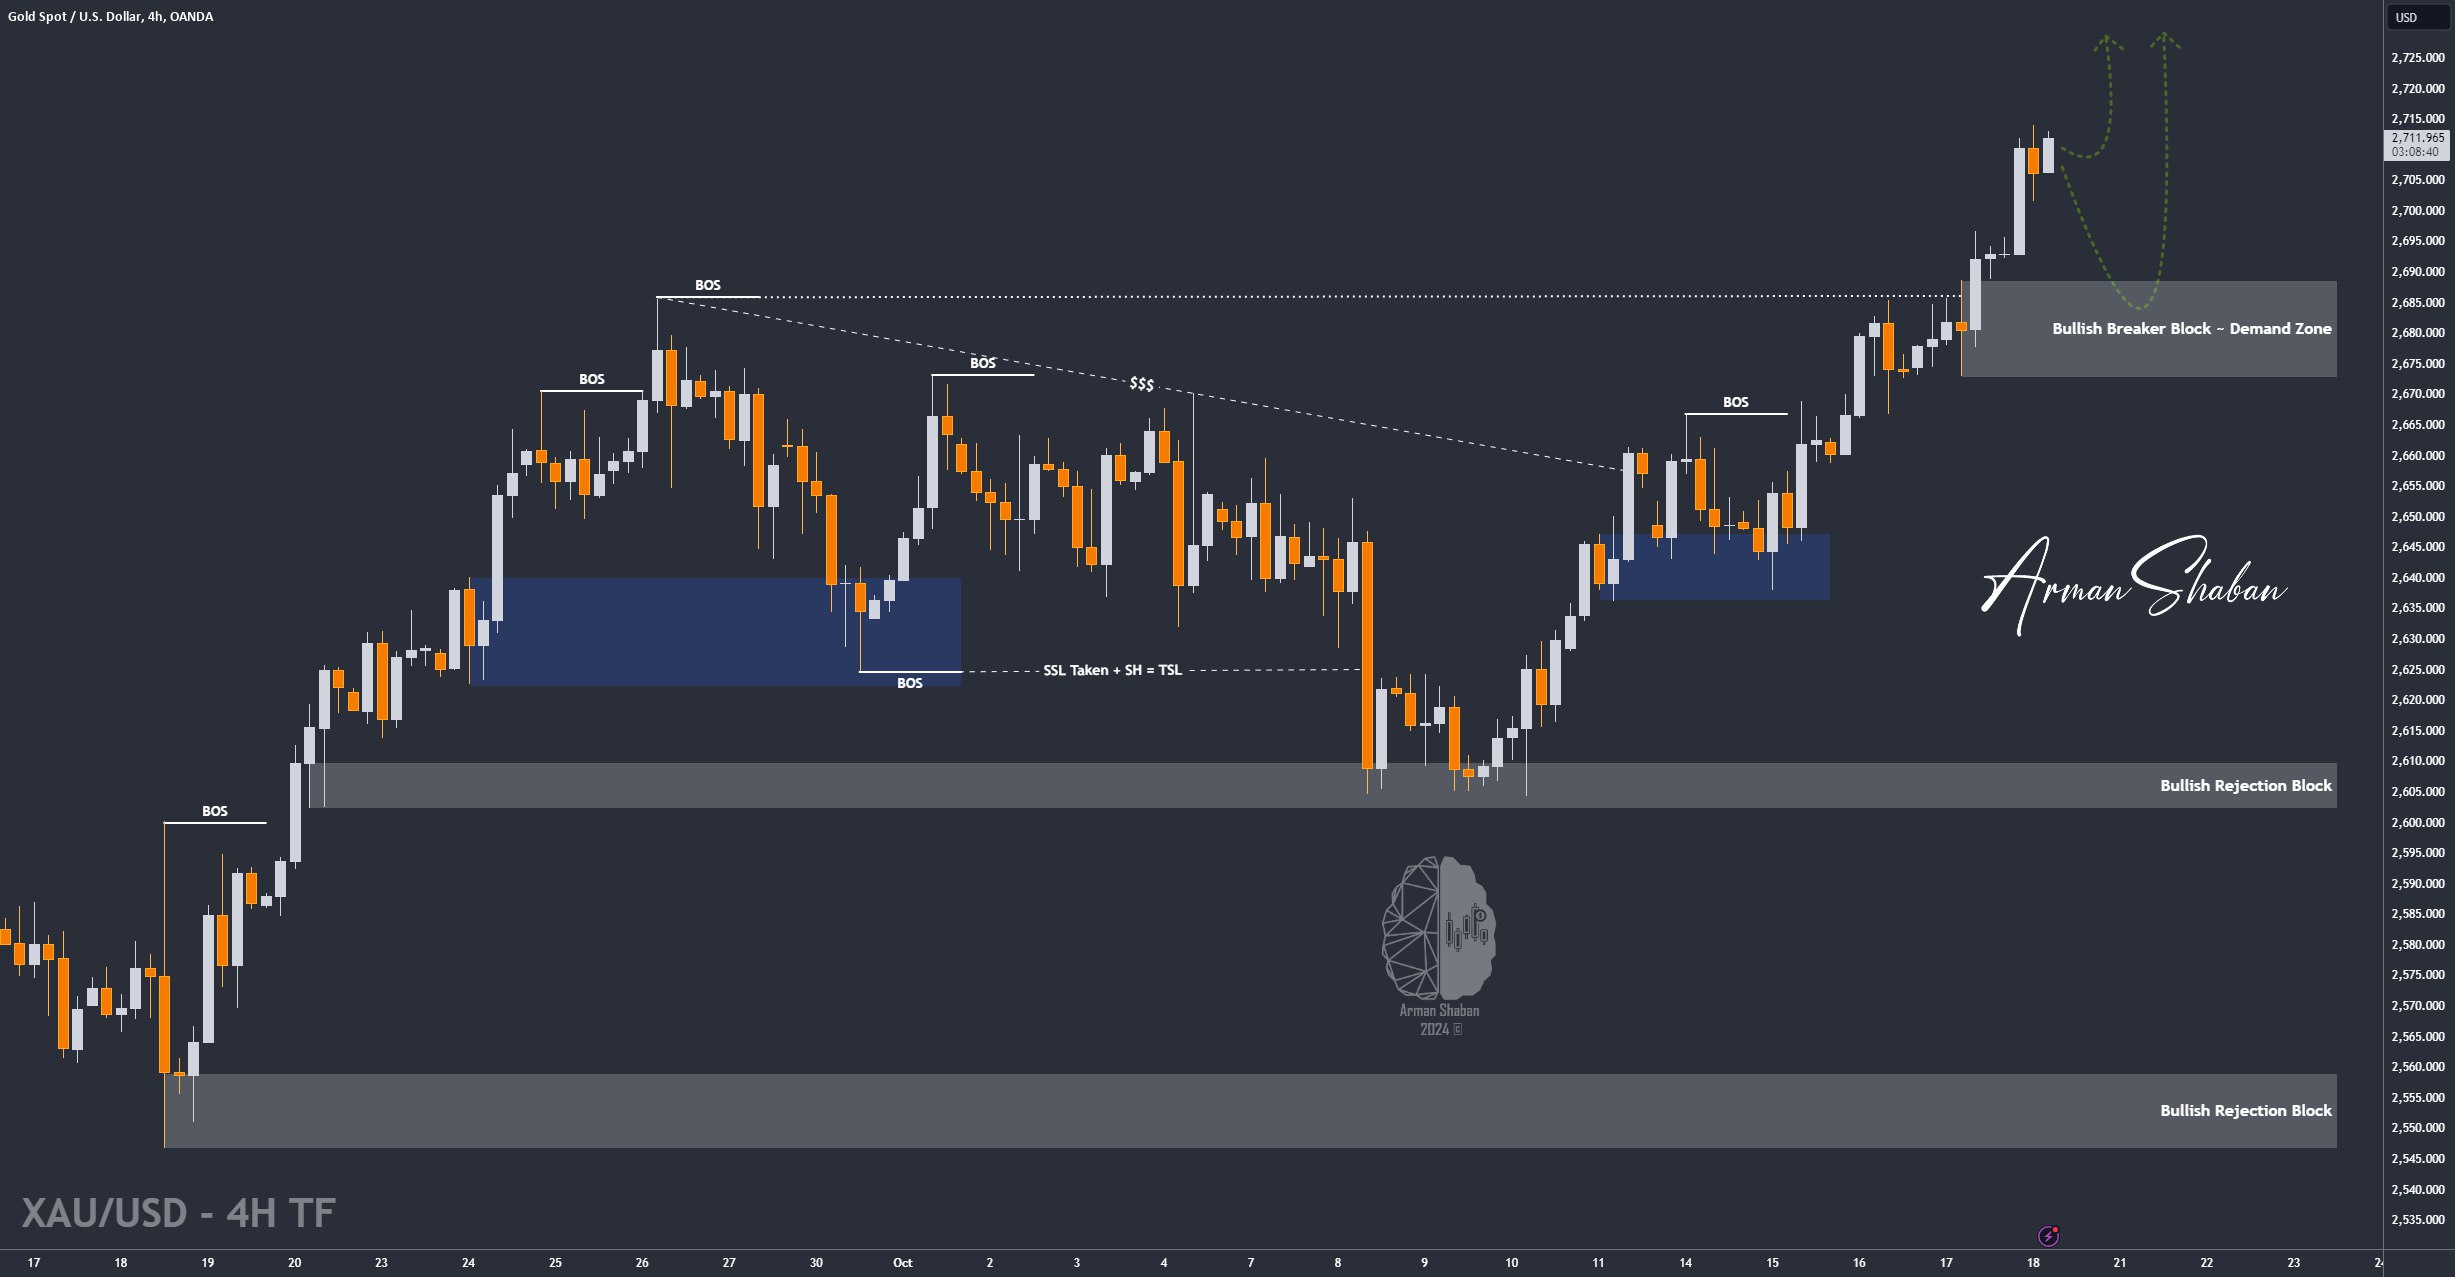
Gold Analysis: Upon reviewing the gold chart on the 4-hour timeframe, we can see that gold has finally managed to break above the $2700 level, just as we anticipated in our previous analysis. Currently, it is consolidating above this level. Note that the $2714 level is a key supply zone (based on important Fibonacci ratios) for gold, which is why the price reacted to it. However, at the moment, gold is trading around $2711, and I still expect further growth from gold unless I see otherwise on the chart, in which case I’ll update you. The next short-term targets for gold are $2727 and $2743.7. Keep an eye on how the price reacts to these levels. Also, the most important support zone for gold is between $2673 and $2688.7.
(This Post on TradingView)
Author : Arman Shaban
To see more analyzes of Gold , Forex Pairs , Cryptocurrencies , Indices and Stocks , be sure to Follow and Join us on other Platforms :
– Public Telegram Channel
– YouTube Channel
– TradingView
– X (Twitter)
– How to join our FOREX VIP Channel ?
– How to join our Crypto VIP Channel ?
– CONTACT ME directly on Telegram