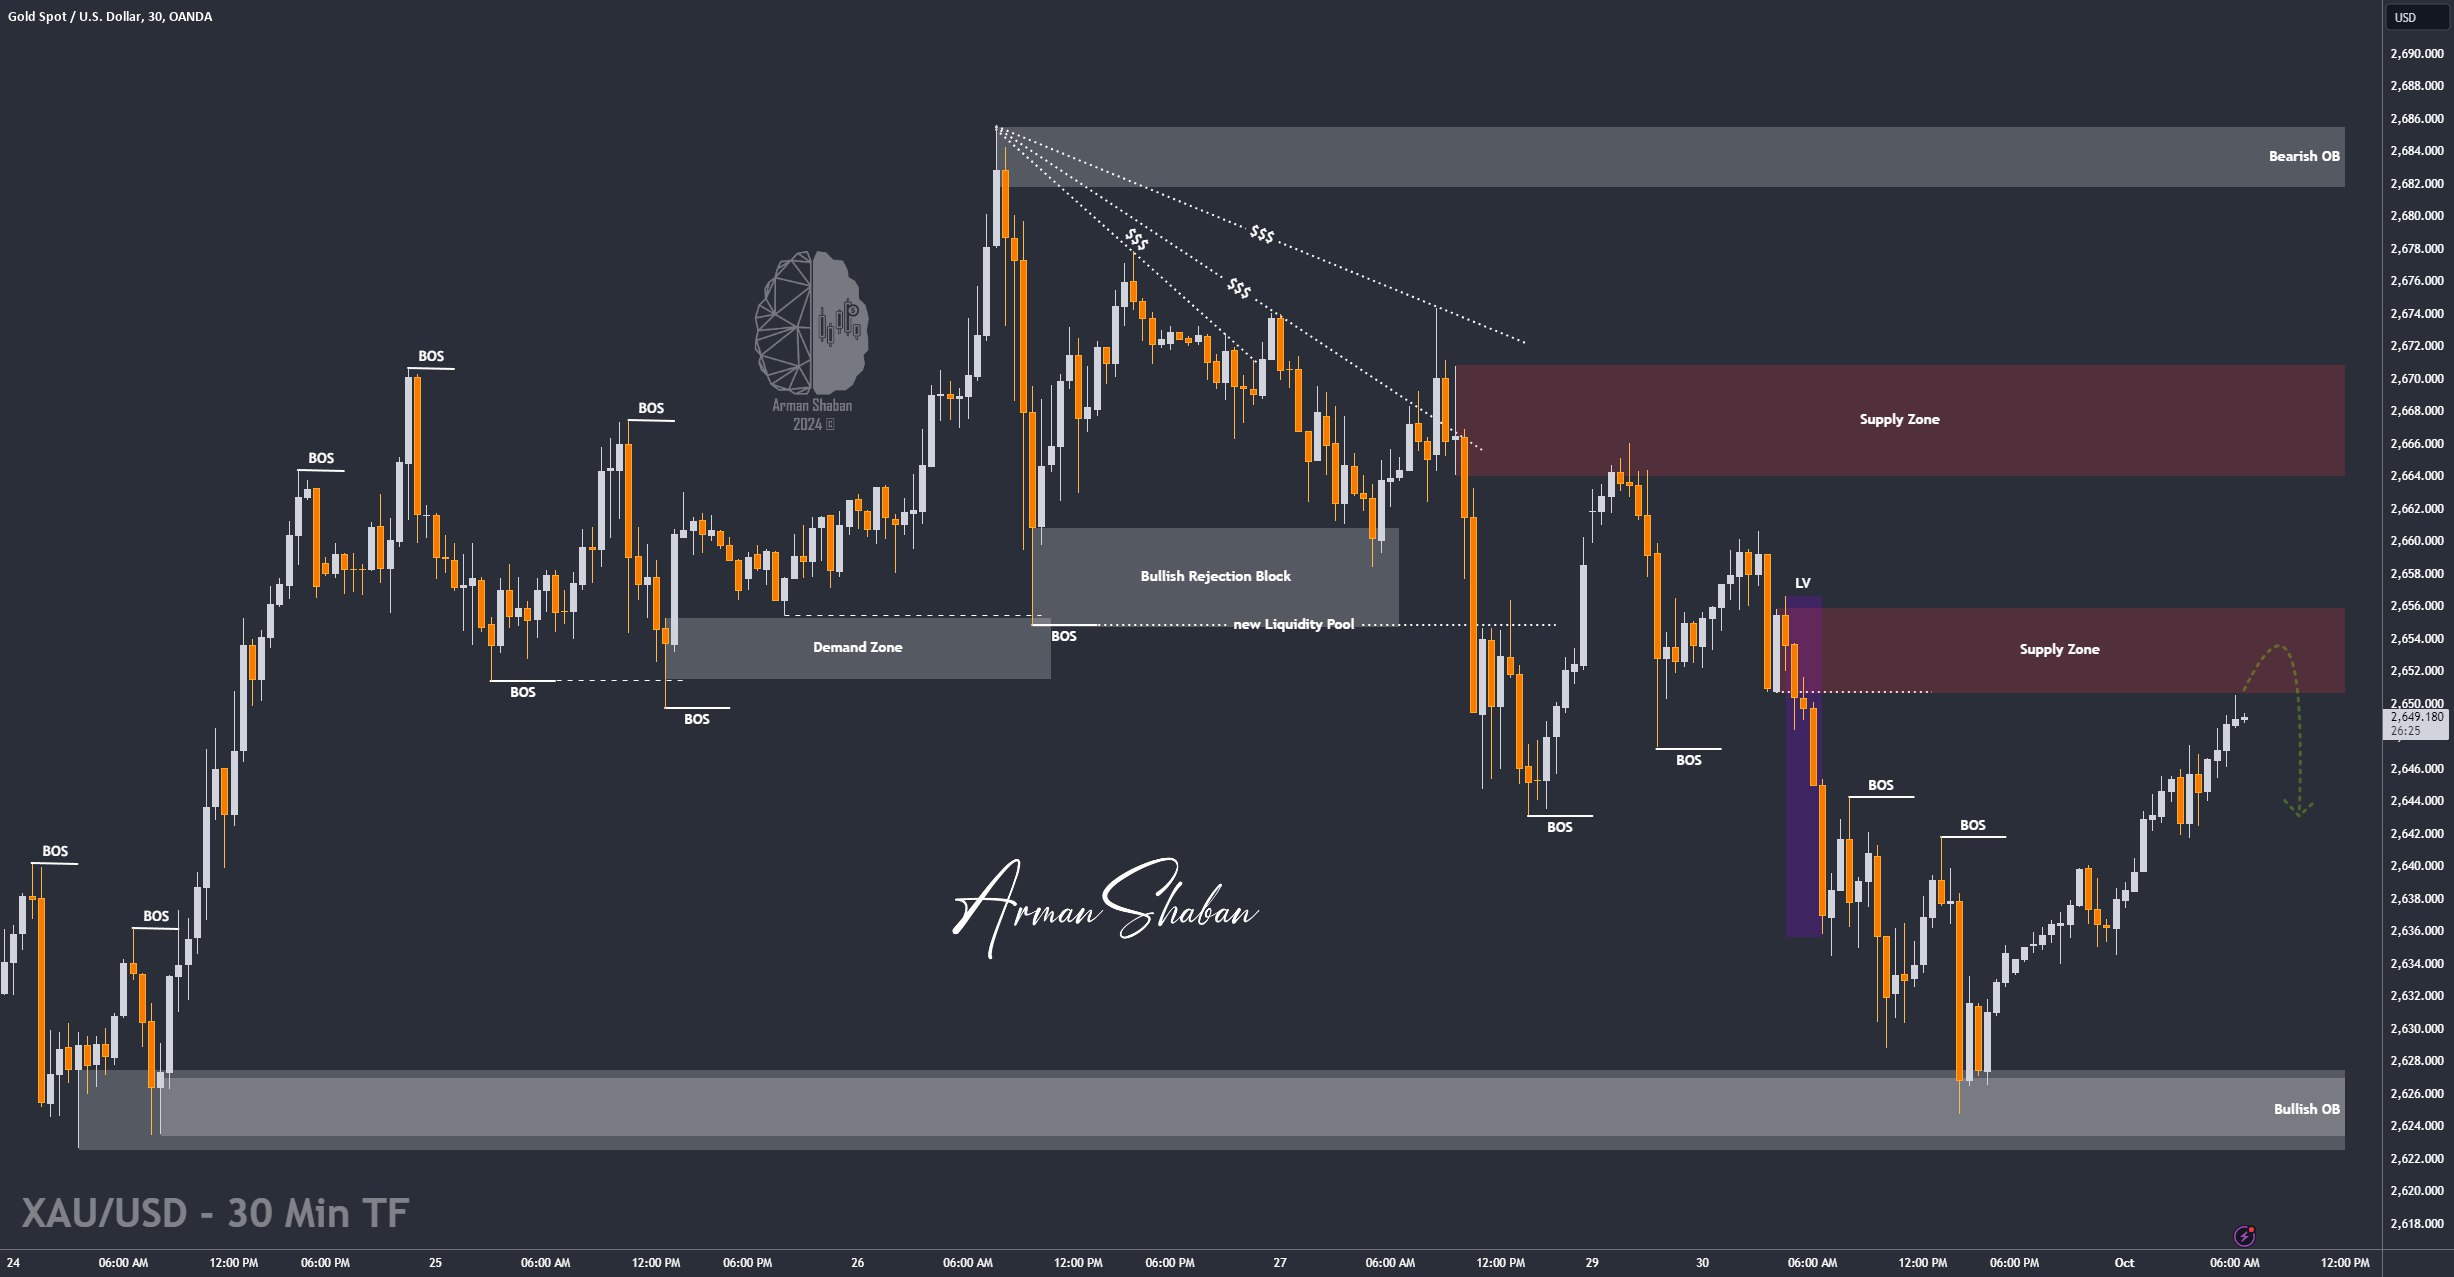
Gold Analysis – 01.Oct.2024

Gold Analysis: By analyzing the gold chart on the 30-minute timeframe, we can see that yesterday, as expected, the price finally dropped to $2624. After reaching this key demand level, it experienced a bullish move and has risen over 250 pips to $2650 so far. The $2651 to $2656 range is a key supply zone, and I expect a price correction once it reaches this area. Keep an eye on the price reaction at this level! (This analysis will be updated.)
(This Post on TradingView)
Author : Arman Shaban
To see more analyzes of Gold , Forex Pairs , Cryptocurrencies , Indices and Stocks , be sure to Follow and Join us on other Platforms :
– Public Telegram Channel
– YouTube Channel
– TradingView
– X (Twitter)
– How to join our FOREX VIP Channel ?
– How to join our Crypto VIP Channel ?
– CONTACT ME directly on Telegram