TonCoin Analysis – 29.Dec.2025
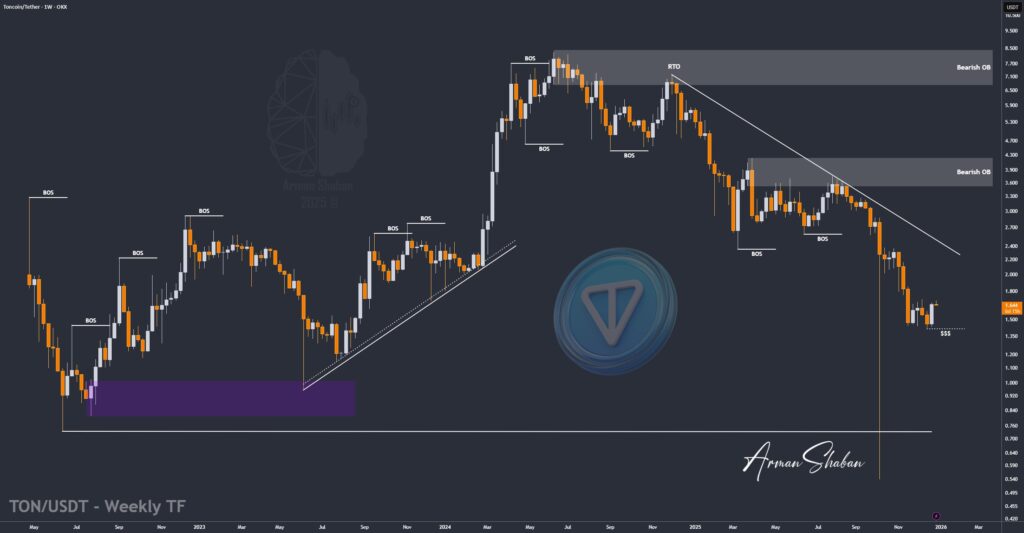
TonCoin Analysis: By analyzing the #TON chart on the weekly timeframe, we can see that after dropping to $1.40, price attracted demand again and is now trading around $1.65. If TON Coin can hold and stabilize above $1.58, we can expect more upside in the short term. The bullish momentum is present but still weak, so…
Read more