Gold Analysis – 17.Jul.2026
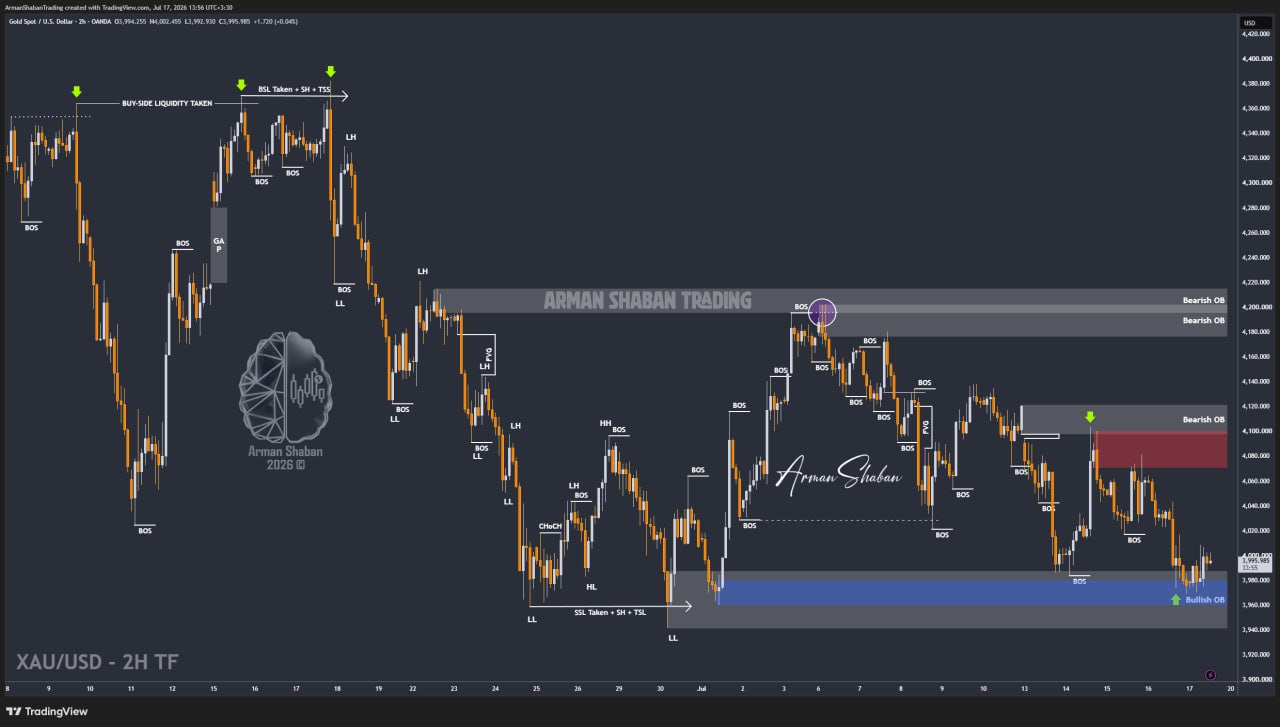
Gold Analysis:By analyzing the #Gold chart on the 2H timeframe, we can see that since the previous update, price has experienced heavy and unstable volatility inside the $3960 – $3980 demand zone.
Several factors are currently affecting Gold at the same time, including rising tensions around the Strait of Hormuz, renewed conflict in southern Iran for the sixth consecutive night, statements from Trump and Warsh, inflation expectations, and changing expectations around U.S. interest rates.
Currently, Gold is trading around $3996. In my view, further downside remains possible and the broader bearish scenario from the previous analysis is still valid.
The key supply zone ahead is located around $4023 – $4038, which may be worth monitoring for a possible bearish reaction. On the downside, the important demand zones remain around $3960 – $3980, followed by $3940 – $3955 and deeper support near $3900 – $3920.
For now, traders should be more careful than usual. This market is extremely headline-driven, so proper risk management and waiting for clear reactions from the key levels are essential.
(This Post on TradingView)
Author : Arman Shaban
To see more analyzes of Gold , Forex Pairs , Cryptocurrencies , Indices and Stocks , be sure to Follow and Join us on other Platforms :
– Public Telegram Channel
– YouTube Channel
– TradingView
– X (Twitter)
– How to join our FOREX VIP Channel ?
– How to join our Crypto VIP Channel ?
– CONTACT ME directly on Telegram

