Gold Analysis – 14.Jul.2026
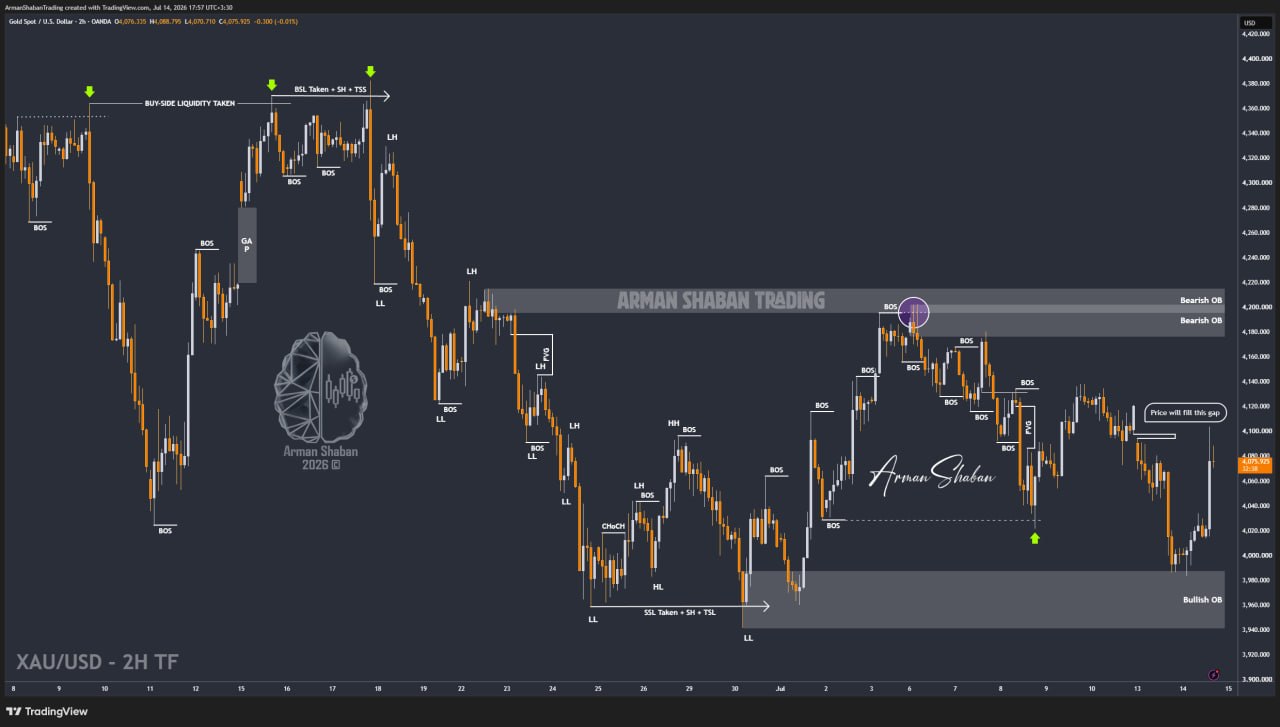
Gold Analysis: By analyzing the #Gold chart on the 2H timeframe, we can see that price followed yesterday’s scenario almost perfectly. Gold first dropped sharply from around $4017 toward $3984, reaching the downside area we had been monitoring. After entering this demand zone, buyers stepped in as expected and pushed price back toward $4033. Later, the CPI report showed that inflation growth is continuing to slow, reducing market expectations for another rate hike. This triggered a strong bullish reaction, with Gold jumping from around $4015 to $4104.
The gap created at the beginning of the week was also completely filled, exactly as marked on the chart in the previous analysis.
Currently, Gold is trading around $4082. Despite this strong recovery, I still believe another bearish move remains possible. Oil prices are still rising and tensions around the Strait of Hormuz continue to increase, which could once again put pressure on Gold in the current market environment. The nearest supply zone is located around $4095 – $4120, followed by stronger resistance between $4140 – $4170. On the downside, the nearest demand zones are around $4040 – $4060, followed by the key $3984 – $4010 area. For now, the reaction around $4100 – $4120 will be very important. A strong rejection could send Gold lower again, while stabilization above this area could open the way toward higher levels.
(This Post on TradingView)
Author : Arman Shaban
To see more analyzes of Gold , Forex Pairs , Cryptocurrencies , Indices and Stocks , be sure to Follow and Join us on other Platforms :
– Public Telegram Channel
– YouTube Channel
– TradingView
– X (Twitter)
– How to join our FOREX VIP Channel ?
– How to join our Crypto VIP Channel ?
– CONTACT ME directly on Telegram

