Gold Analysis – 30.Apr.2026
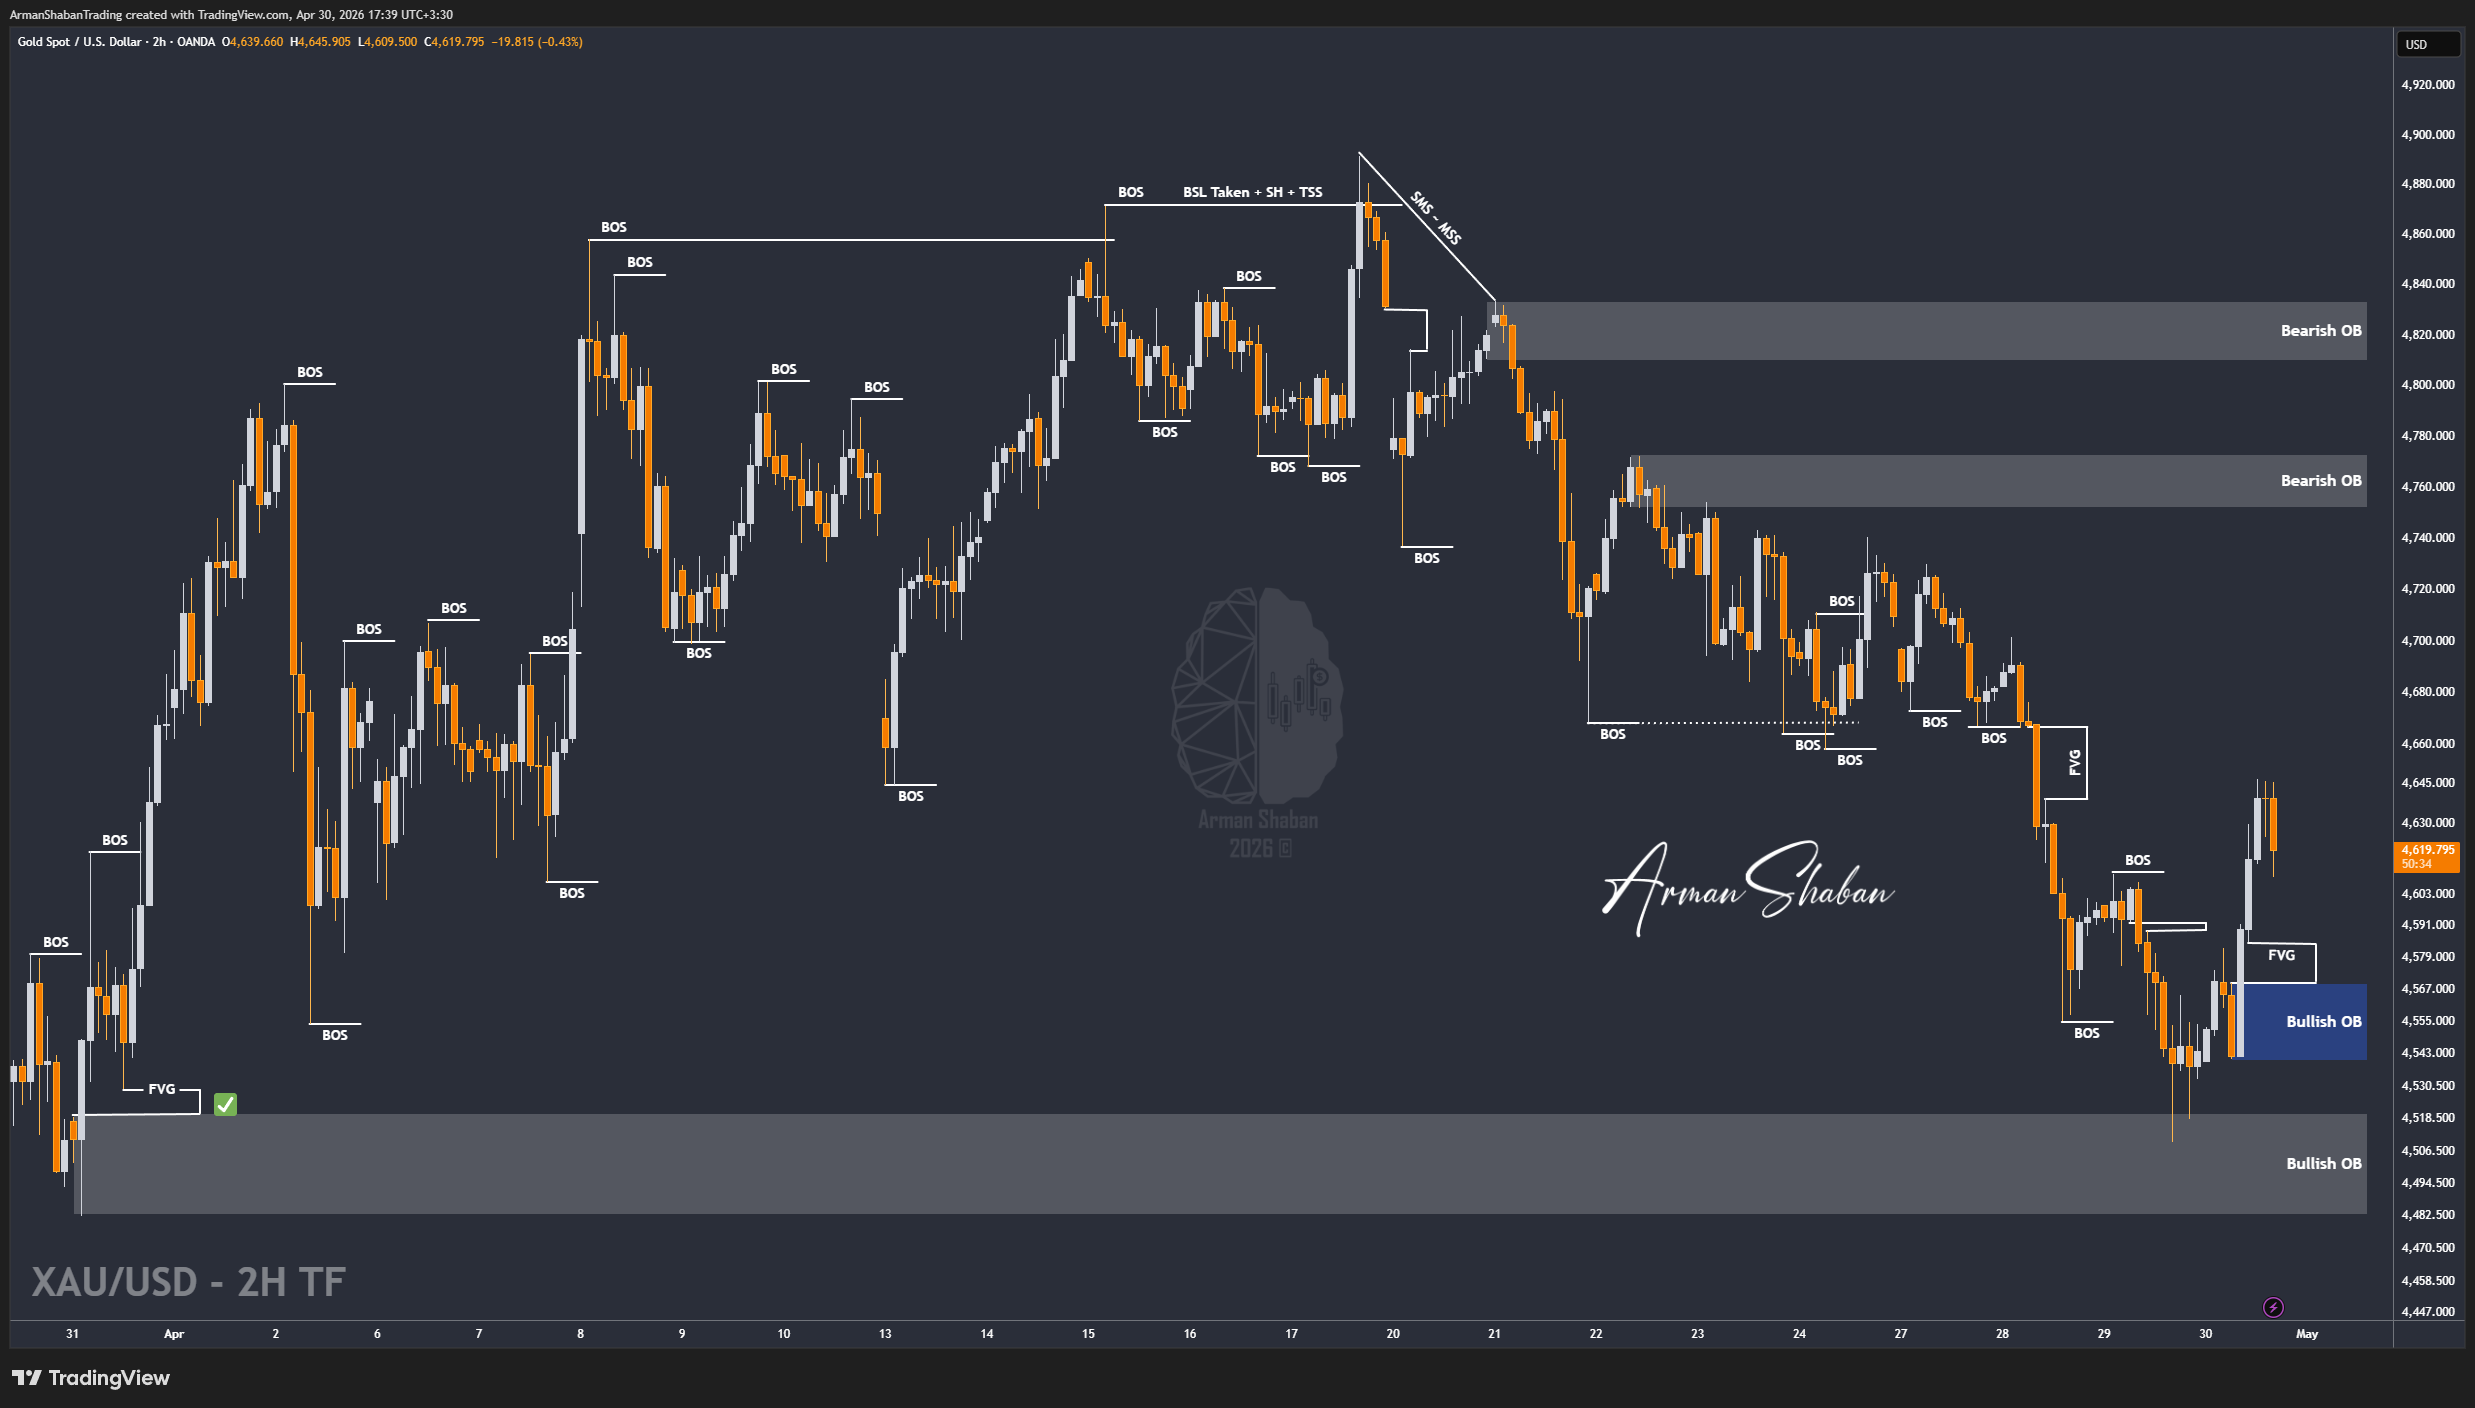
Gold Analysis: By analyzing the #Gold chart on the 4H timeframe, we can see that price followed the plan perfectly. After bouncing from $4543 to $4583 and entering the marked supply zone, sellers stepped in and pushed price back down to $4541, completing a clean round-trip move with more than 800 pips of return. After that, Gold pushed higher again toward $4646, but once again faced strong selling pressure and dropped to around $4609. Currently, price is trading near the $4622 region, sitting just below a key resistance.
From a structural perspective, the $4620 – $4646 zone is now acting as a critical supply area. As long as price fails to break and stabilize above $4646, the market is likely to enter another corrective phase. The nearest demand zones are $4580 – $4600, with deeper support around $4520 – $4550.
In my view, if price remains below this resistance over the next few hours, we can expect short-term downside continuation. The next short-term bearish targets are $4600, followed by $4580, then $4550, and potentially $4520 if selling pressure builds again.
(This Post on TradingView)
Author : Arman Shaban
To see more analyzes of Gold , Forex Pairs , Cryptocurrencies , Indices and Stocks , be sure to Follow and Join us on other Platforms :
– Public Telegram Channel
– YouTube Channel
– TradingView
– X (Twitter)
– How to join our FOREX VIP Channel ?
– How to join our Crypto VIP Channel ?
– CONTACT ME directly on Telegram