Gold Analysis – 01.Aug.2025
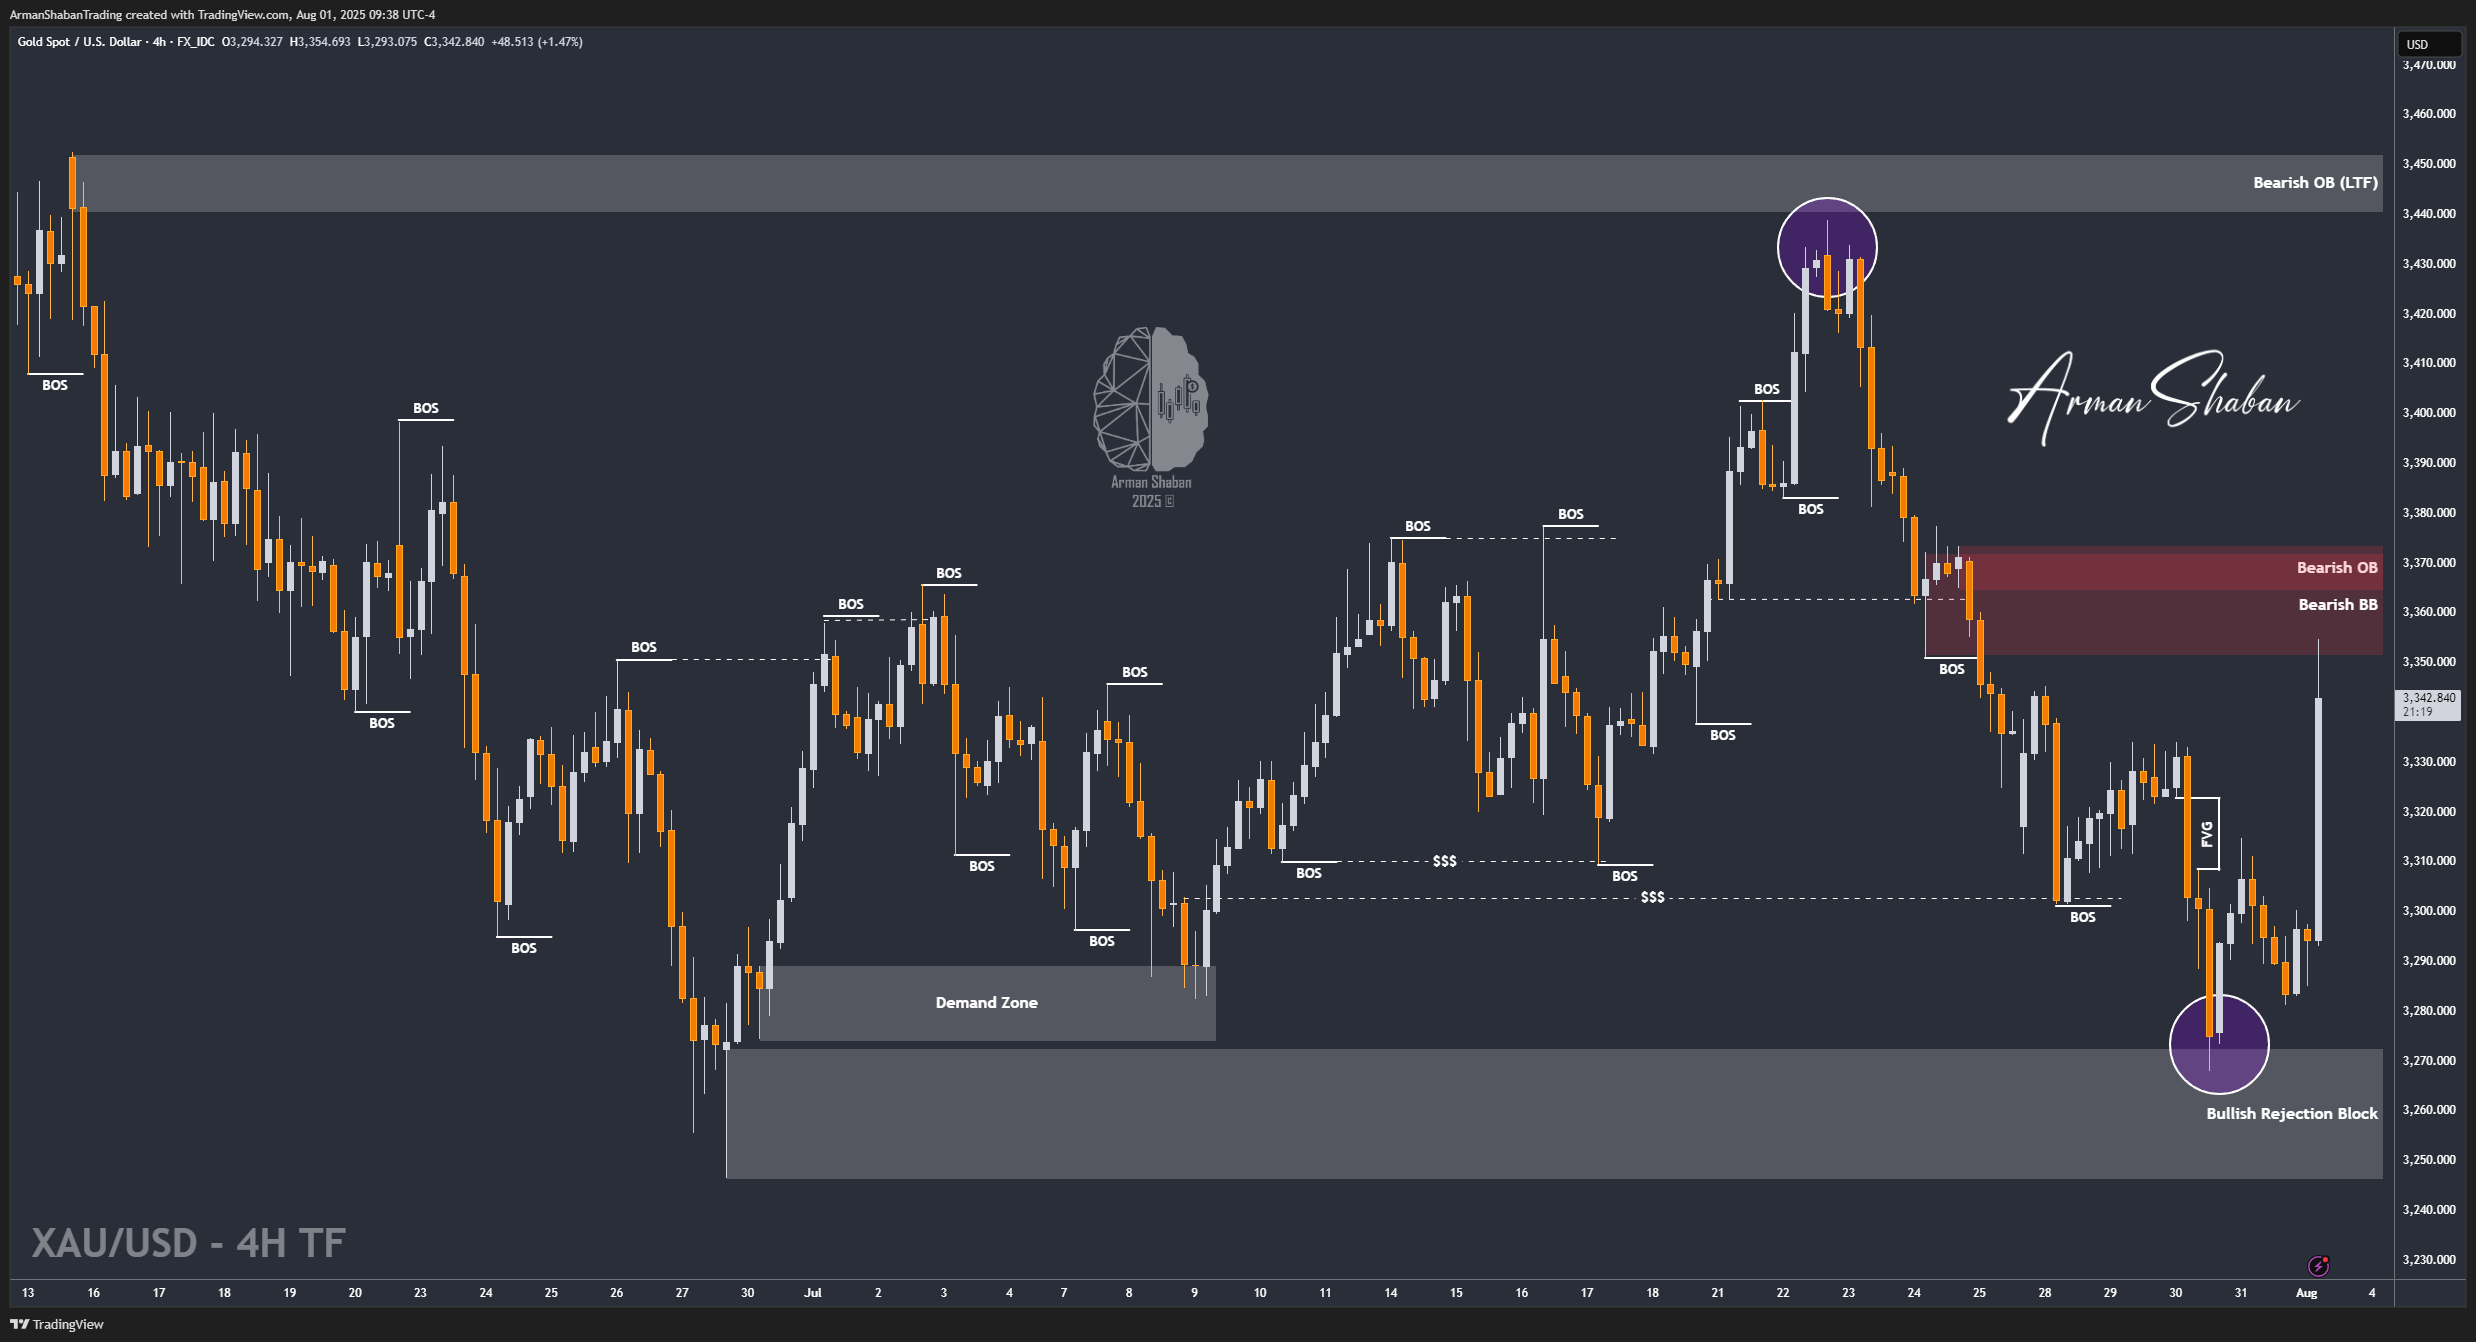
Gold Analysis: By analyzing the gold chart on the 4-hour timeframe, we can see that earlier today, after dropping to $3281, gold managed to climb back above $3300. Following the revised U.S. NFP data, a strong bullish rally pushed the price up to $3355, where it met a key bearish breaker block and began a slight correction. It’s currently trading around $3346. So far, there are no clear signs of a strong reversal, and in my opinion, opening SHORT positions here is quite risky under current conditions. I recommend focusing only on major levels like $3371, $3385, and $3398 for potential setups. Key demand zones to watch are $3311, $3301, $3293, and $3286.
(This Post on TradingView)
Author : Arman Shaban
To see more analyzes of Gold , Forex Pairs , Cryptocurrencies , Indices and Stocks , be sure to Follow and Join us on other Platforms :
– Public Telegram Channel
– YouTube Channel
– TradingView
– X (Twitter)
– How to join our FOREX VIP Channel ?
– How to join our Crypto VIP Channel ?
– CONTACT ME directly on Telegram