Gold Analysis – 01.May.2025
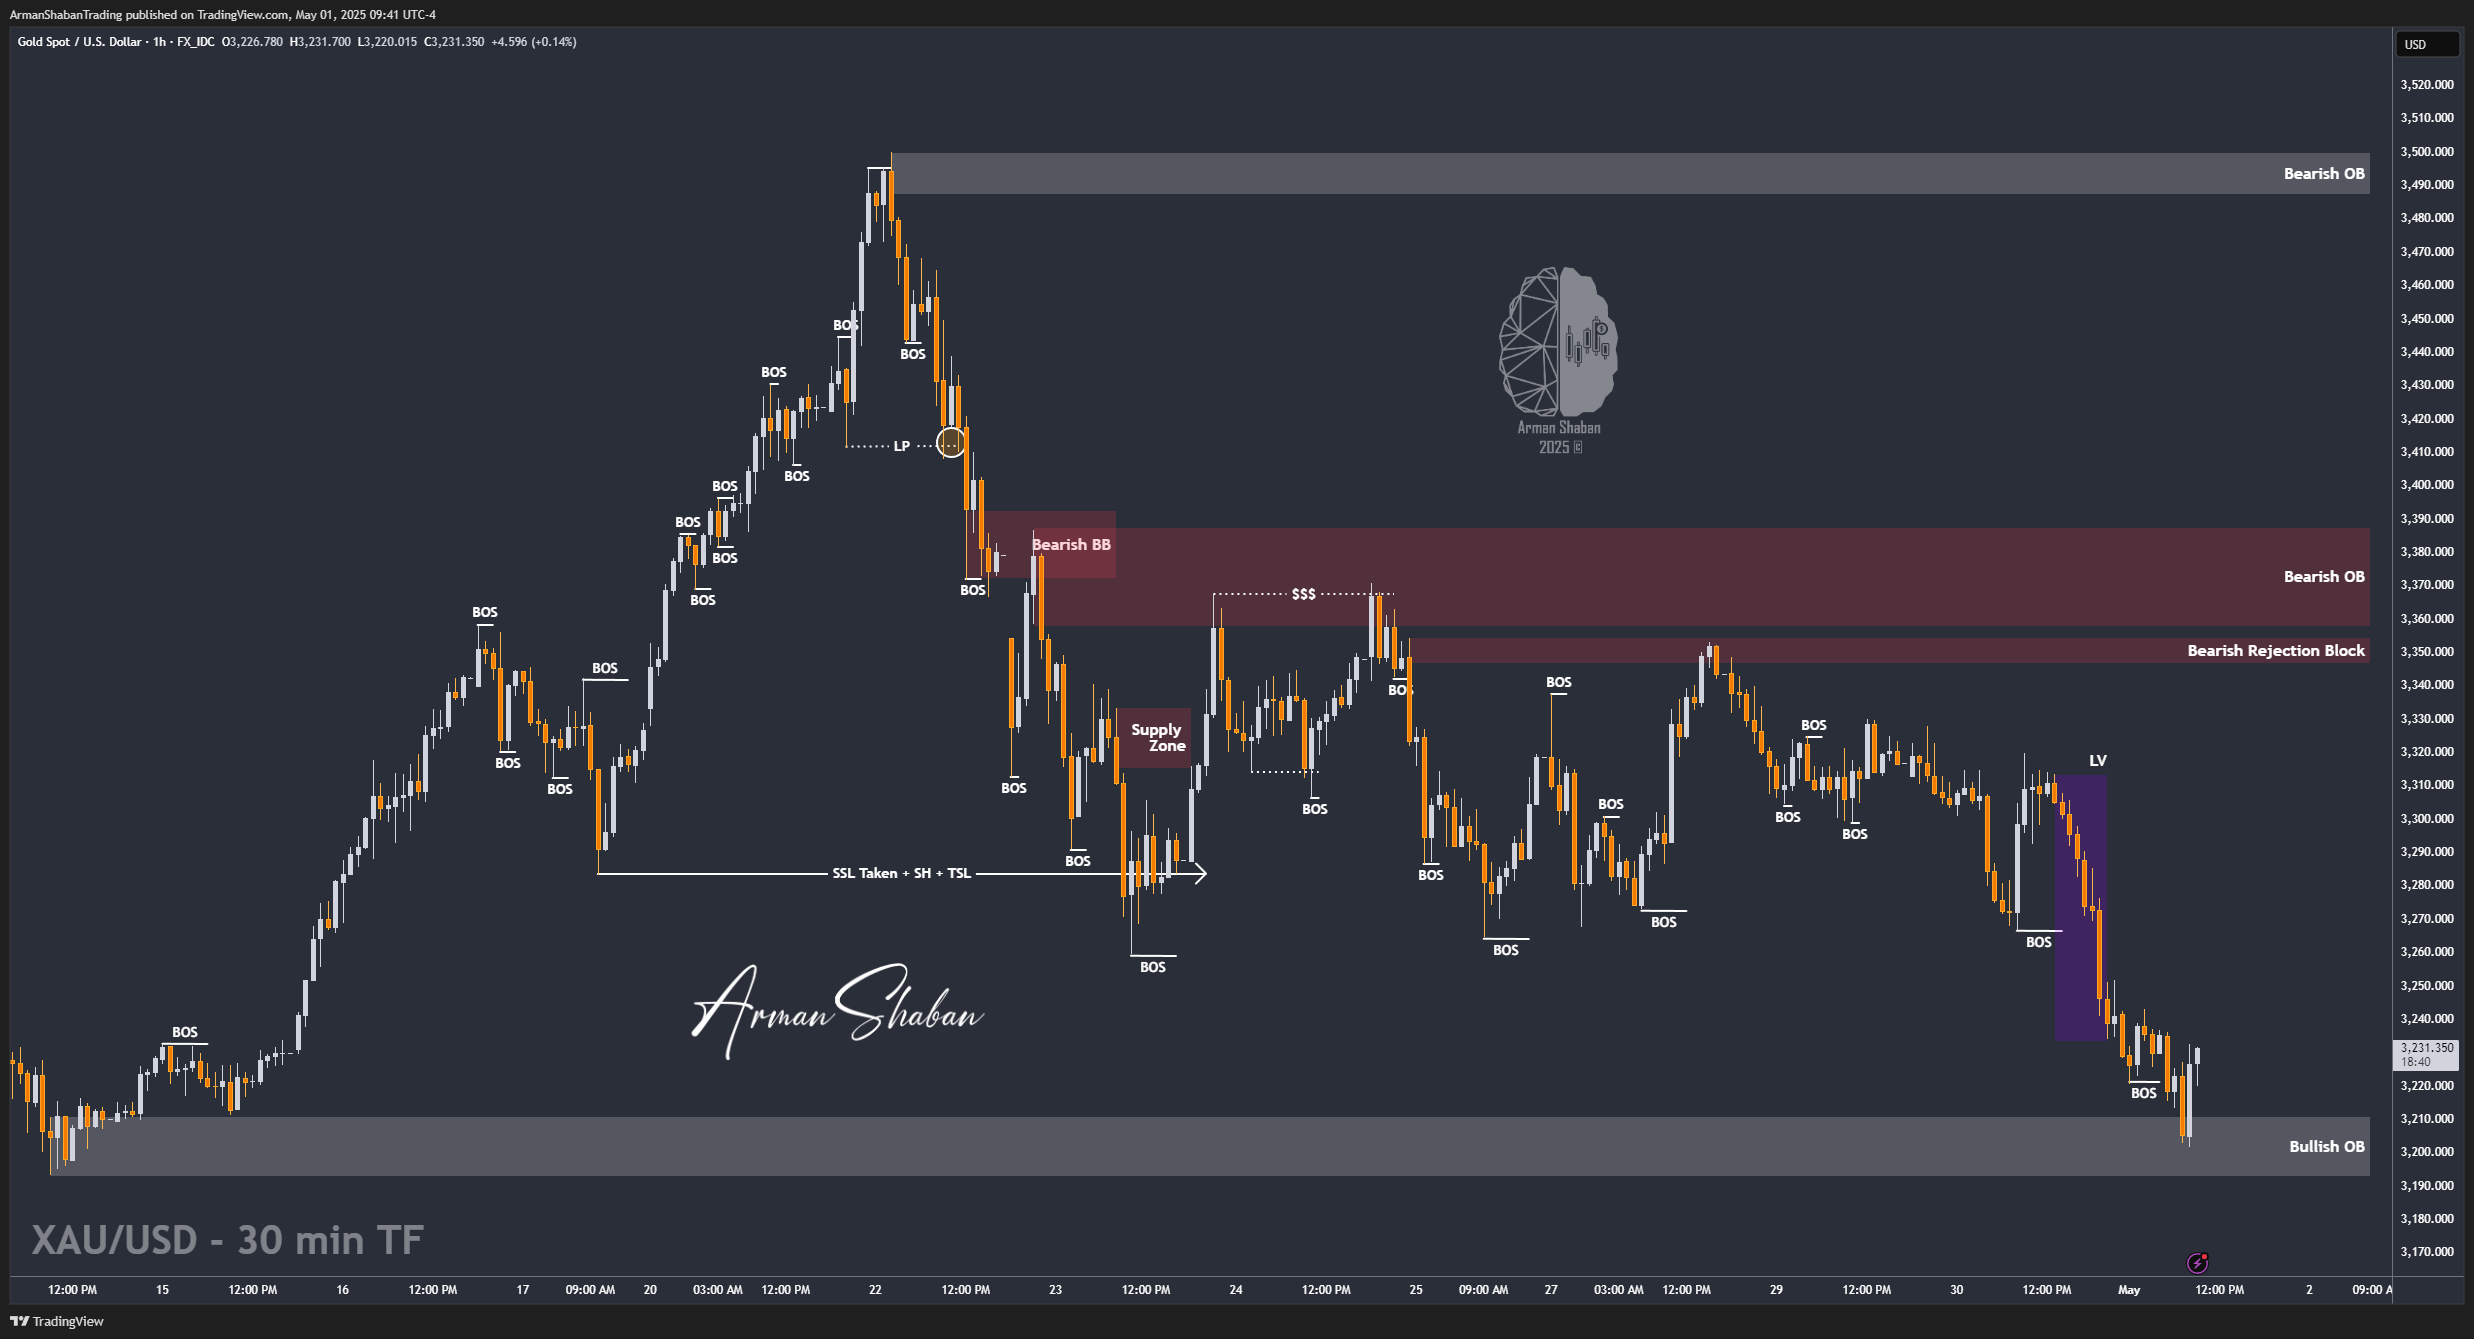
Gold Analysis: By analyzing the gold chart on the 1-hour timeframe, we can see that, once again, as expected, the price first filled the liquidity gap between $3288 and $3303, and then dropped sharply, correcting all the way down to $3202 — nearly a 1000-pip drop in one day! Currently, gold is trading around $3227. If it stabilizes below $3236, we can expect further downside. However, if it manages to break above the $3236 resistance, a bullish move toward $3307 may follow.
(This Post on TradingView)
Author : Arman Shaban
To see more analyzes of Gold , Forex Pairs , Cryptocurrencies , Indices and Stocks , be sure to Follow and Join us on other Platforms :
– Public Telegram Channel
– YouTube Channel
– TradingView
– X (Twitter)
– How to join our FOREX VIP Channel ?
– How to join our Crypto VIP Channel ?
– CONTACT ME directly on Telegram