Gold Analysis – 30.Sep.2024
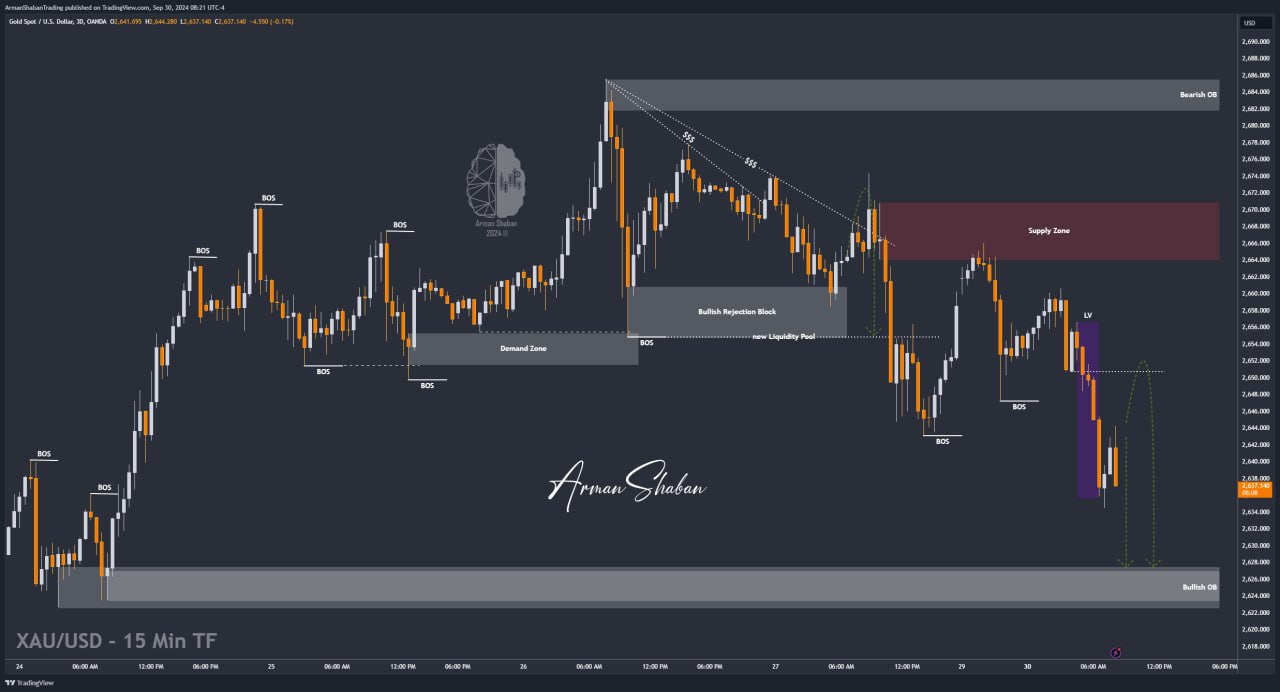
Gold Analysis: By analyzing the gold chart on the 30-minute timeframe, we can see that the price followed the expected scenario. After hitting the targets at $2669 and $2671, it continued to rise and reached $2674 to grab the liquidity above that level before starting to drop. It precisely hit the target I marked on the chart at $2655! After that, we witnessed further correction in gold, and just an hour ago, gold dropped over 400 pips to $2634! Currently, gold is trading around $2638, and it is likely to see another correction after filling the liquidity gap between $2648 and $2650. The key demand zone for gold is between $2622 and $2627.
(This Post on TradingView)
Author : Arman Shaban
To see more analyzes of Gold , Forex Pairs , Cryptocurrencies , Indices and Stocks , be sure to Follow and Join us on other Platforms :
– Public Telegram Channel
– YouTube Channel
– TradingView
– X (Twitter)
– How to join our FOREX VIP Channel ?
– How to join our Crypto VIP Channel ?
– CONTACT ME directly on Telegram