Gold Analysis – 13.Sep.2024
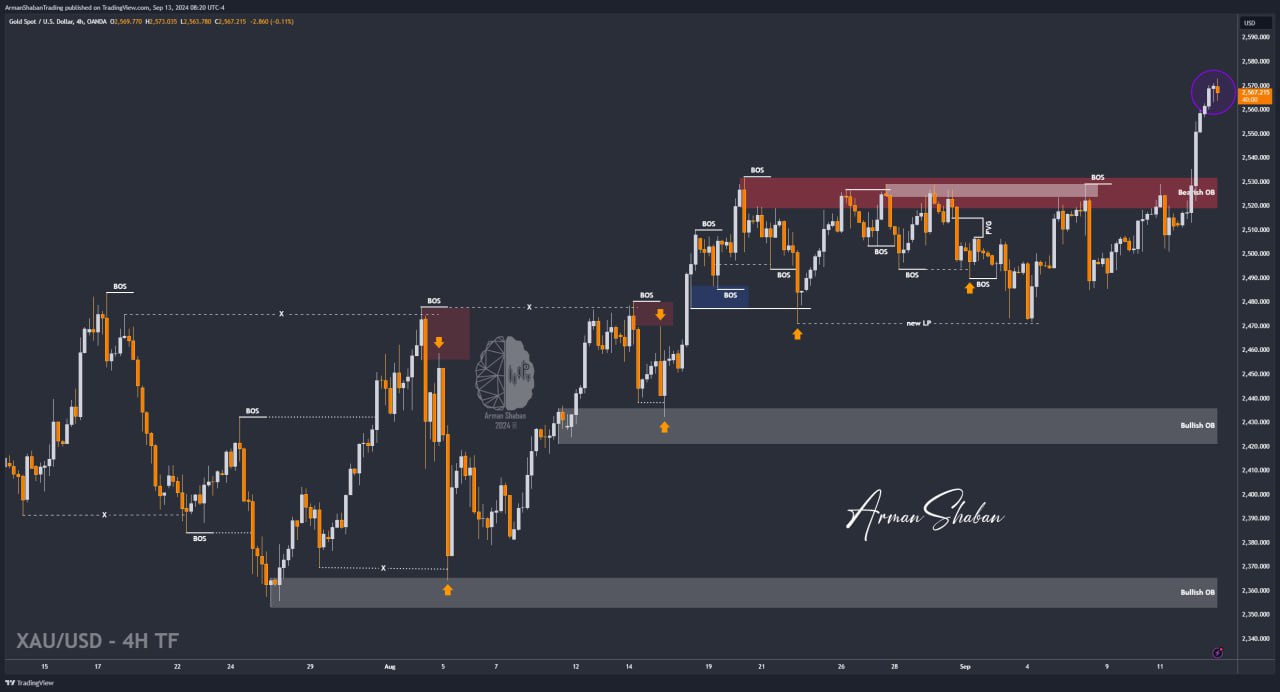
Gold Analysis: By analyzing the gold chart on the 4-hour timeframe, we can see that, as expected, the price finally broke through the $2532 level and made a strong move up to $2573! Currently, gold is trading around $2567, and unless you see a powerful reversal movement on the chart, don’t expect a significant drop in the price. Most of these moves are likely short-term corrections. To confirm a more substantial correction, it’s better to check the 1-hour timeframe and wait for the formation of reversal patterns. For a BUY position, the price is currently in the Premium zone, and we know that buying in this zone is much riskier than taking a SELL position without confirmation of a reversal. I hope this explanation is helpful, and stay tuned for the next gold update on lower timeframes soon!
(This Post on TradingView)
Author : Arman Shaban
To see more analyzes of Gold , Forex Pairs , Cryptocurrencies , Indices and Stocks , be sure to Follow and Join us on other Platforms :
– Public Telegram Channel
– YouTube Channel
– TradingView
– X (Twitter)
– How to join our FOREX VIP Channel ?
– How to join our Crypto VIP Channel ?
– CONTACT ME directly on Telegram