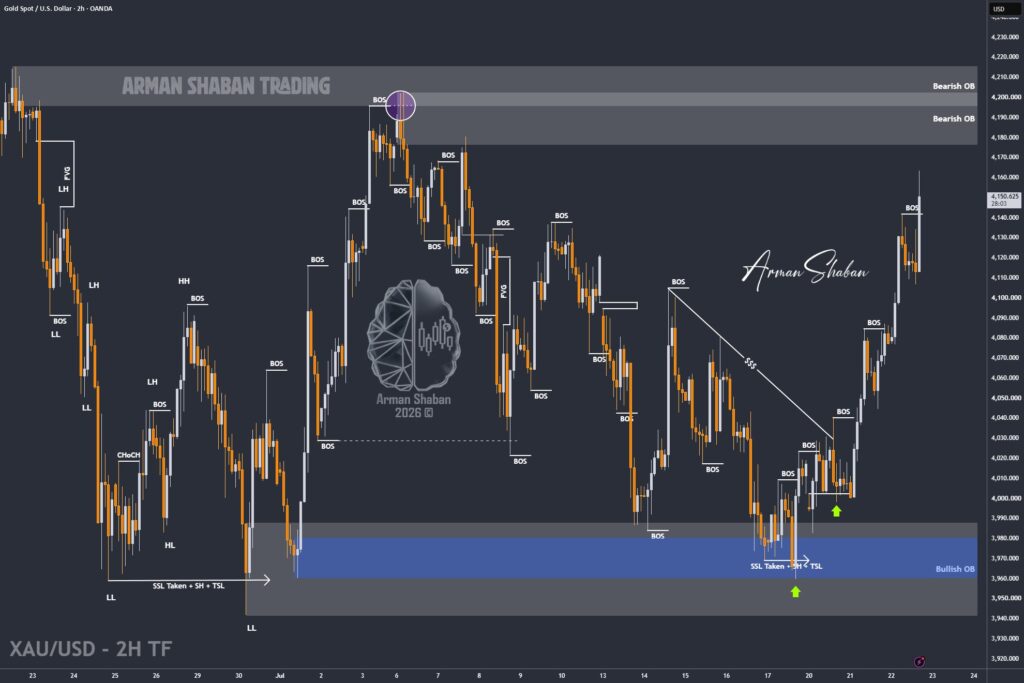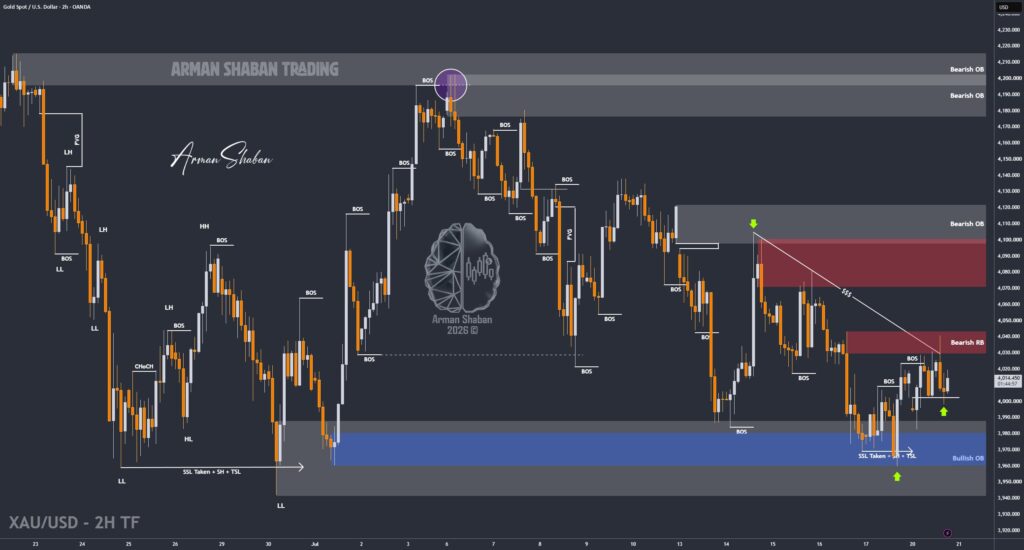
Gold Analysis – 24.Jul.2026
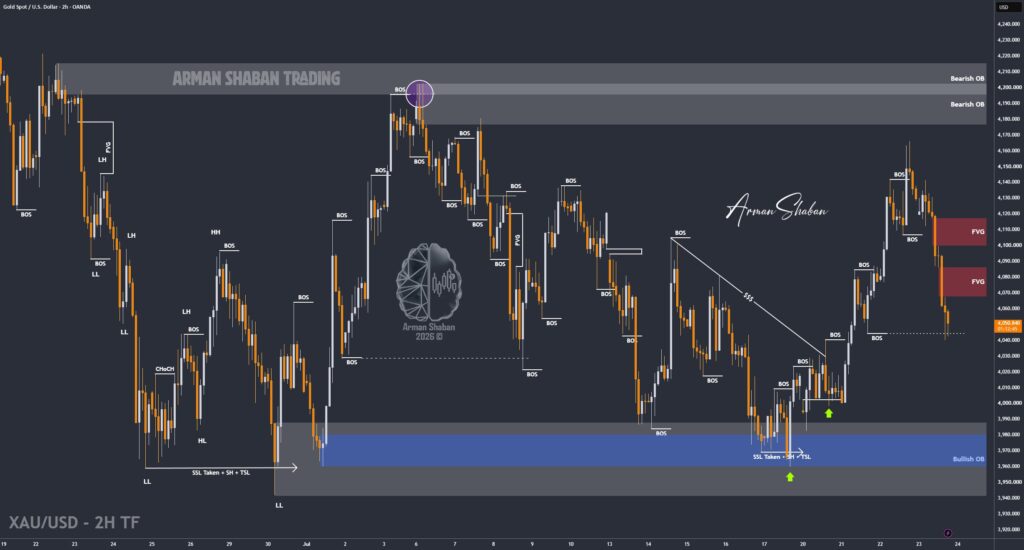
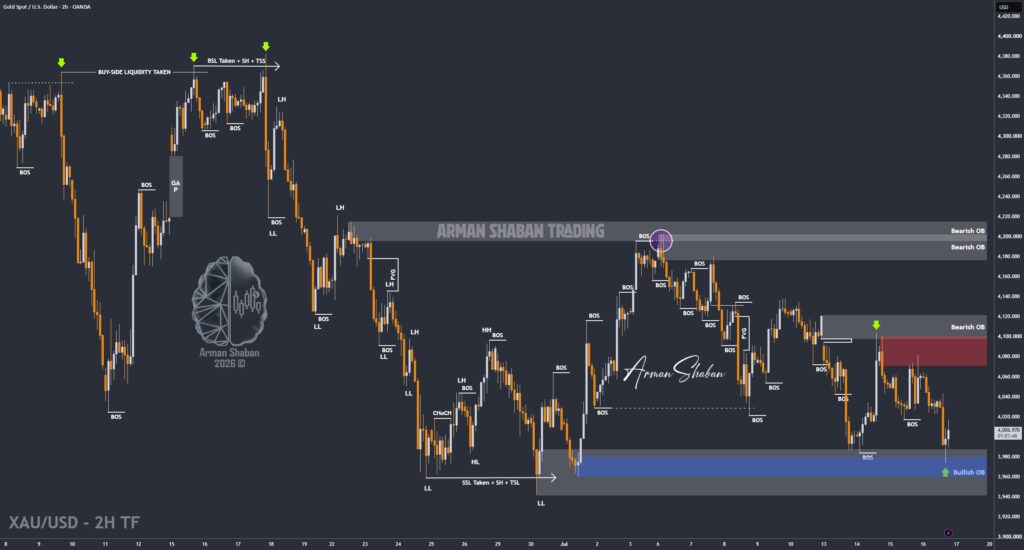
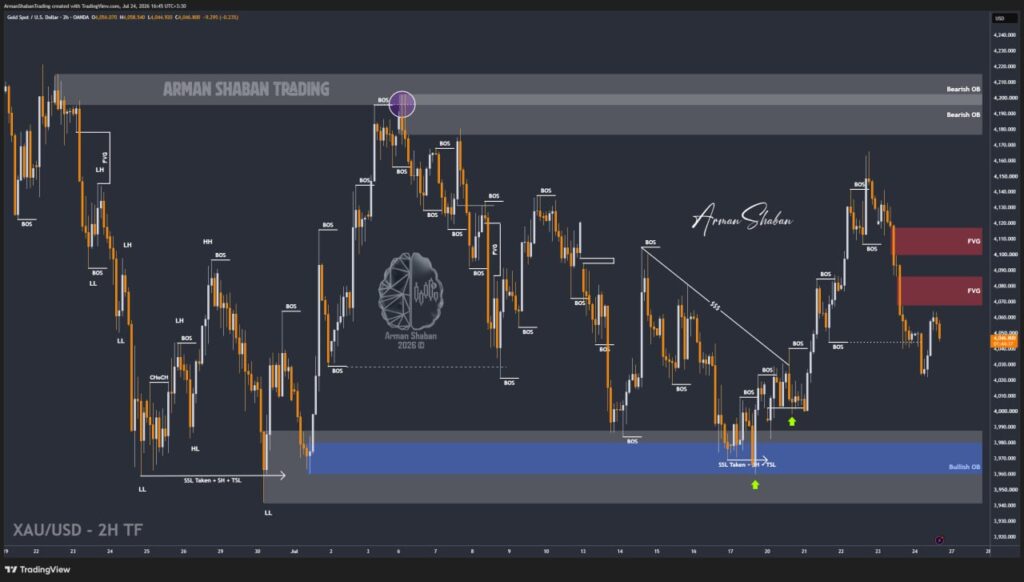
Gold Analysis: By analyzing the #Gold chart on the 2H timeframe, we can see that after the previous analysis, price continued lower and reached the $4021 region. After that decline, buyers stepped in and pushed Gold back toward $4063. However, this recovery remained limited and price has started correcting again. Gold is currently trading around $4047.…
Read more