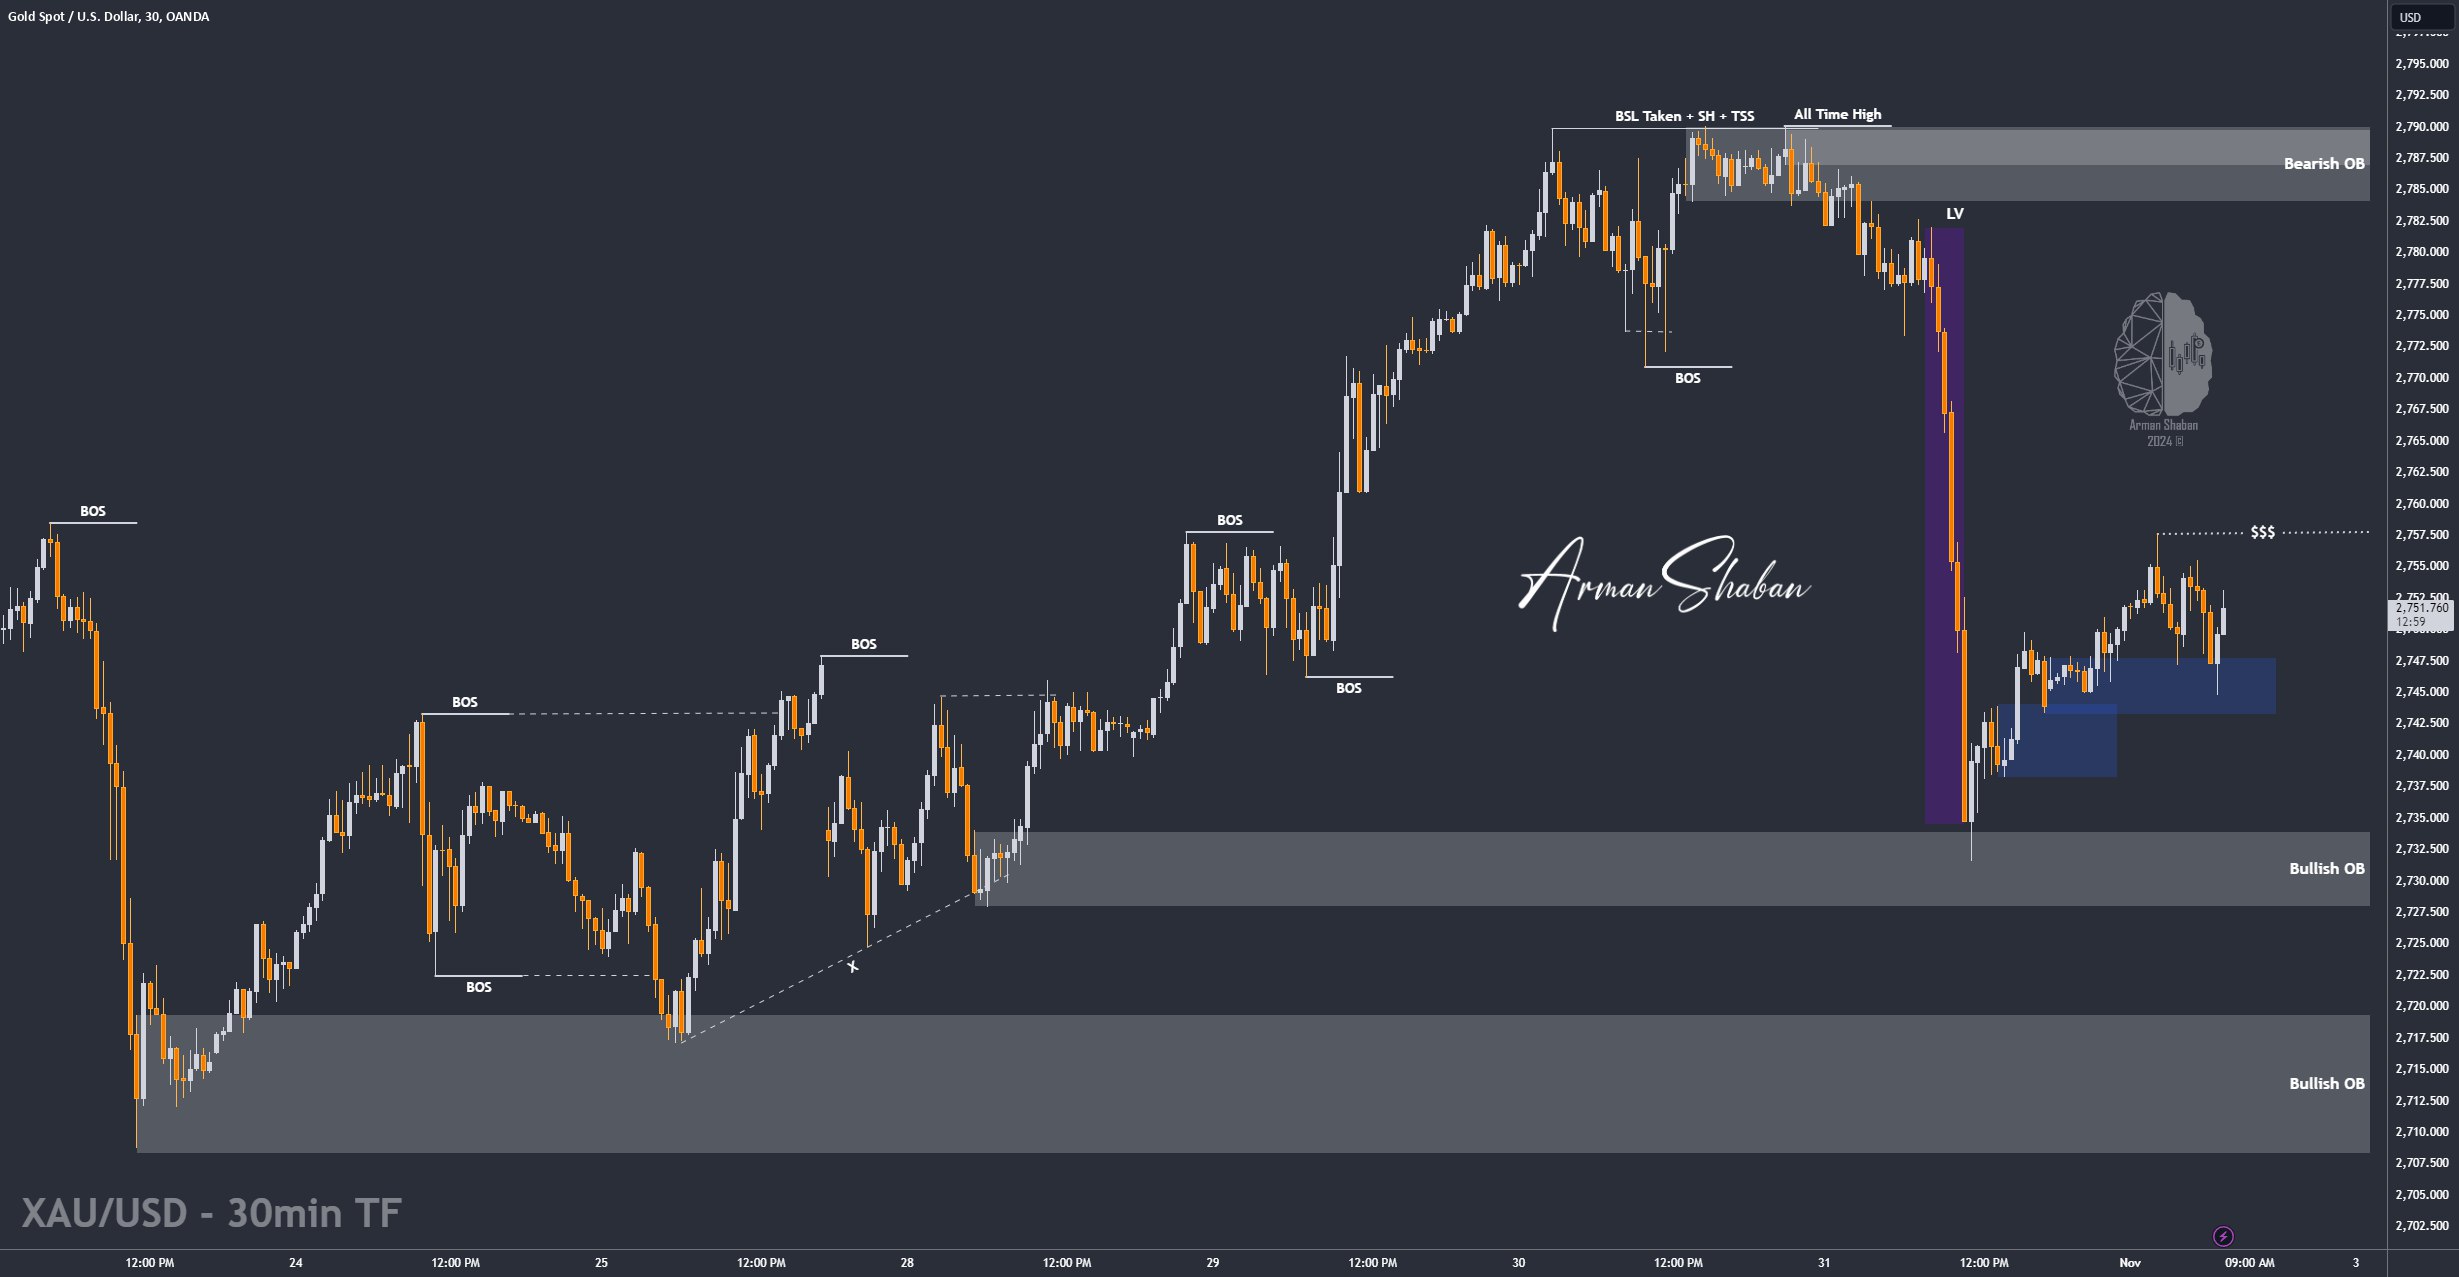
Gold Analysis – 01.Nov.2024

Gold Analysis: By analyzing the #Gold chart in the 30-minute timeframe, we can see that, as observed last night, gold dropped sharply from $2782 to $2731, creating a significant liquidity gap. As mentioned yesterday, the first key demand zone was between $2733-$2735, and once the price reached this critical zone, it was met with buying pressure, leading to a rebound of over 250 pips, taking gold up to $2757. Currently, gold is trading around $2752, with the NFP report ahead. If the NFP data comes in lower than the forecast, it could push gold to higher levels. Conversely, if the data is higher than expected, we might see further declines in gold. There’s no certainty here, so I prefer to observe rather than make any trades on gold today. Good luck, friends!
(This Post on TradingView)
Author : Arman Shaban
To see more analyzes of Gold , Forex Pairs , Cryptocurrencies , Indices and Stocks , be sure to Follow and Join us on other Platforms :
– Public Telegram Channel
– YouTube Channel
– TradingView
– X (Twitter)
– How to join our FOREX VIP Channel ?
– How to join our Crypto VIP Channel ?
– CONTACT ME directly on Telegram