Gold News – 21.Oct.2024
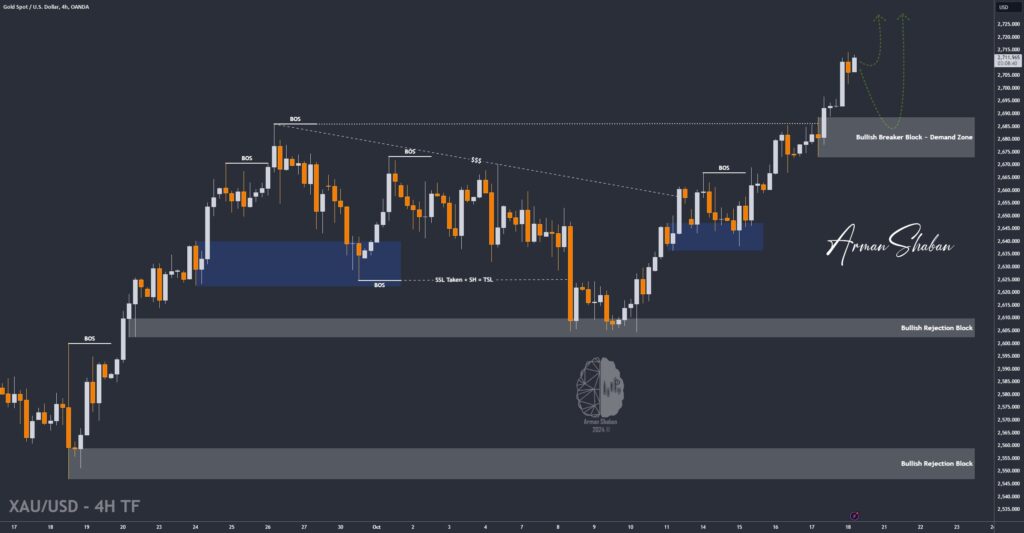
Gold News Gold Price Surge: Gold climbed to around $2,730 per ounce, hitting new record highs due to increased demand for safe-haven assets. Middle East Tensions: Heightened tensions between Hezbollah and Israel are contributing to gold’s appeal. US Elections Uncertainty: Concerns over the upcoming US presidential elections are driving demand for safe-haven investments. Monetary Policies:…
Read more